Asset health history
Overview
The Asset Health History Dashboard is tailored to provide insights into the health of assets within a specific branch. The dashboard is organized into two distinct sections: the top section and the bottom section.
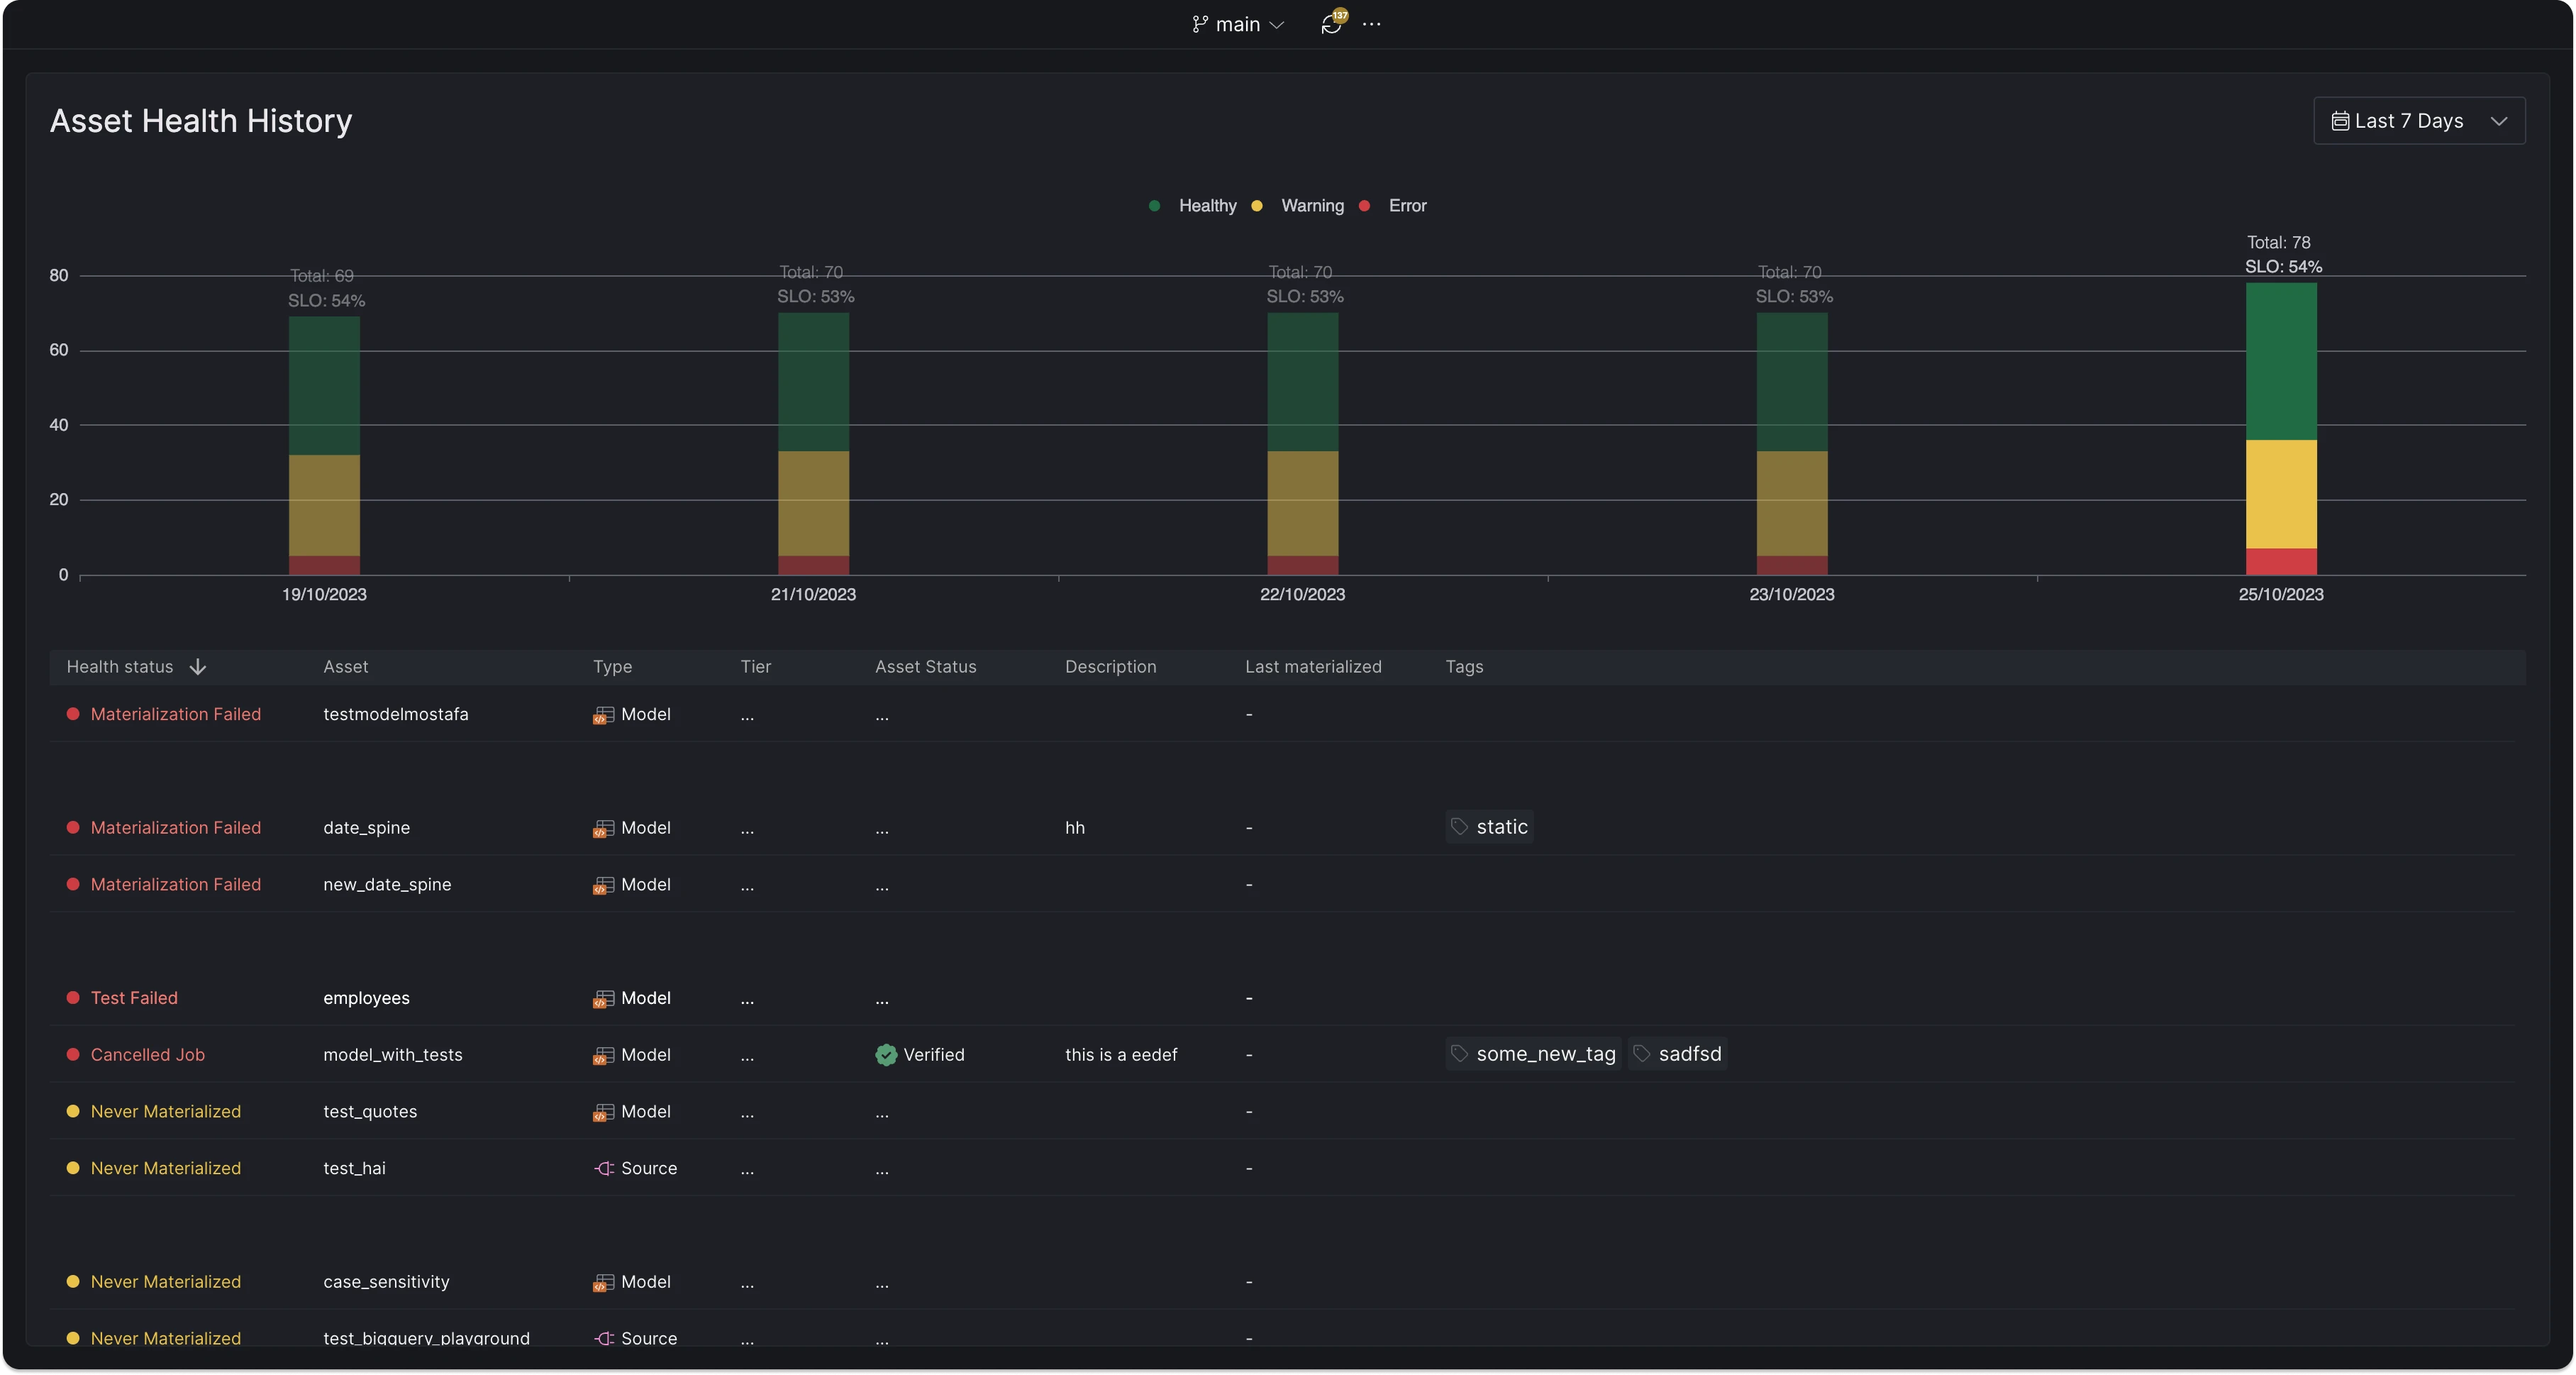
Overview of the Asset Health History dashboard.
Top section: Daily breakdown
The top section allows you to view asset health data split by day. You can configure the number of days to look back, providing a historical perspective on asset health.
Bottom section: Table view
The bottom section features a table view that is similar to the one found in the Asset Health Dashboard. This table lists each asset along with relevant information such as its current status, type, tier, description, tags, and the last time it was materialized. The data presented corresponds to the specific day selected from the daily breakdown in the top section, allowing you to zero in on asset health for a particular day.
Enabling the Asset Health History Dashboard
By default, the Asset Health History Dashboard is disabled.
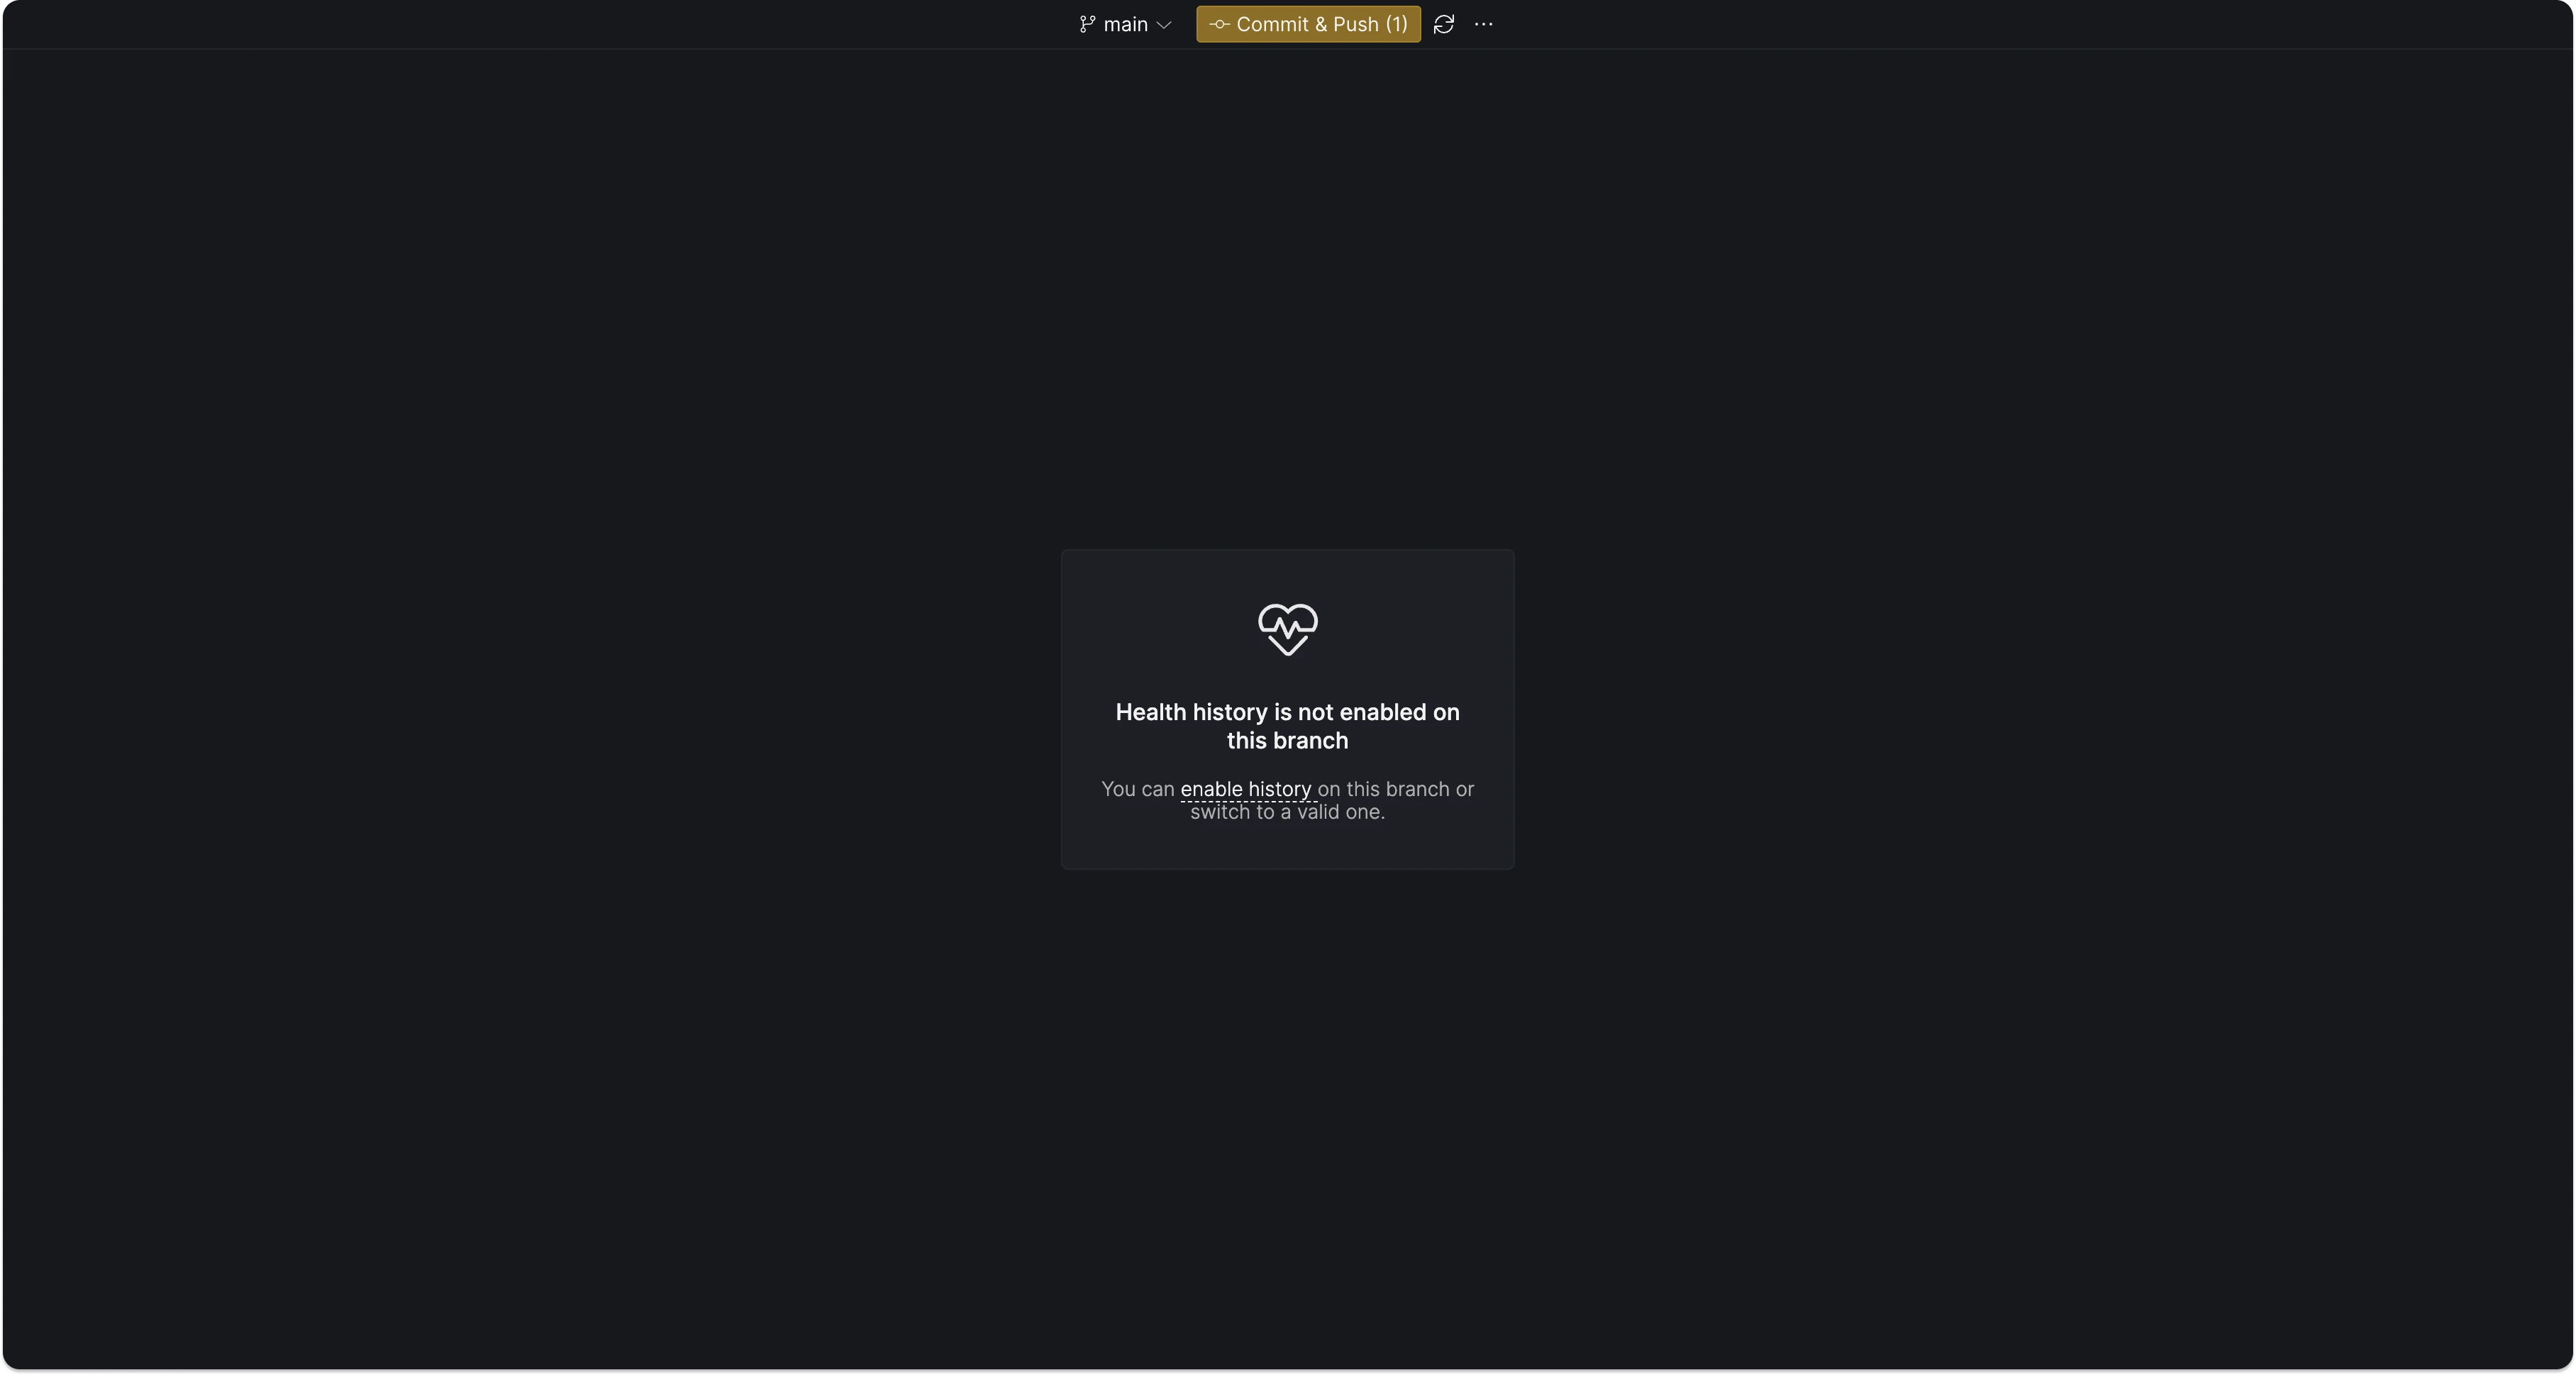
Choose a branch where history is already activated, or enable history for a new branch.
To enable it, navigate to the Branch Environments menu and choose the branch where you'd like to activate history tracking. You're not restricted to a single branch; you can enable history for as many branches as you wish to monitor.
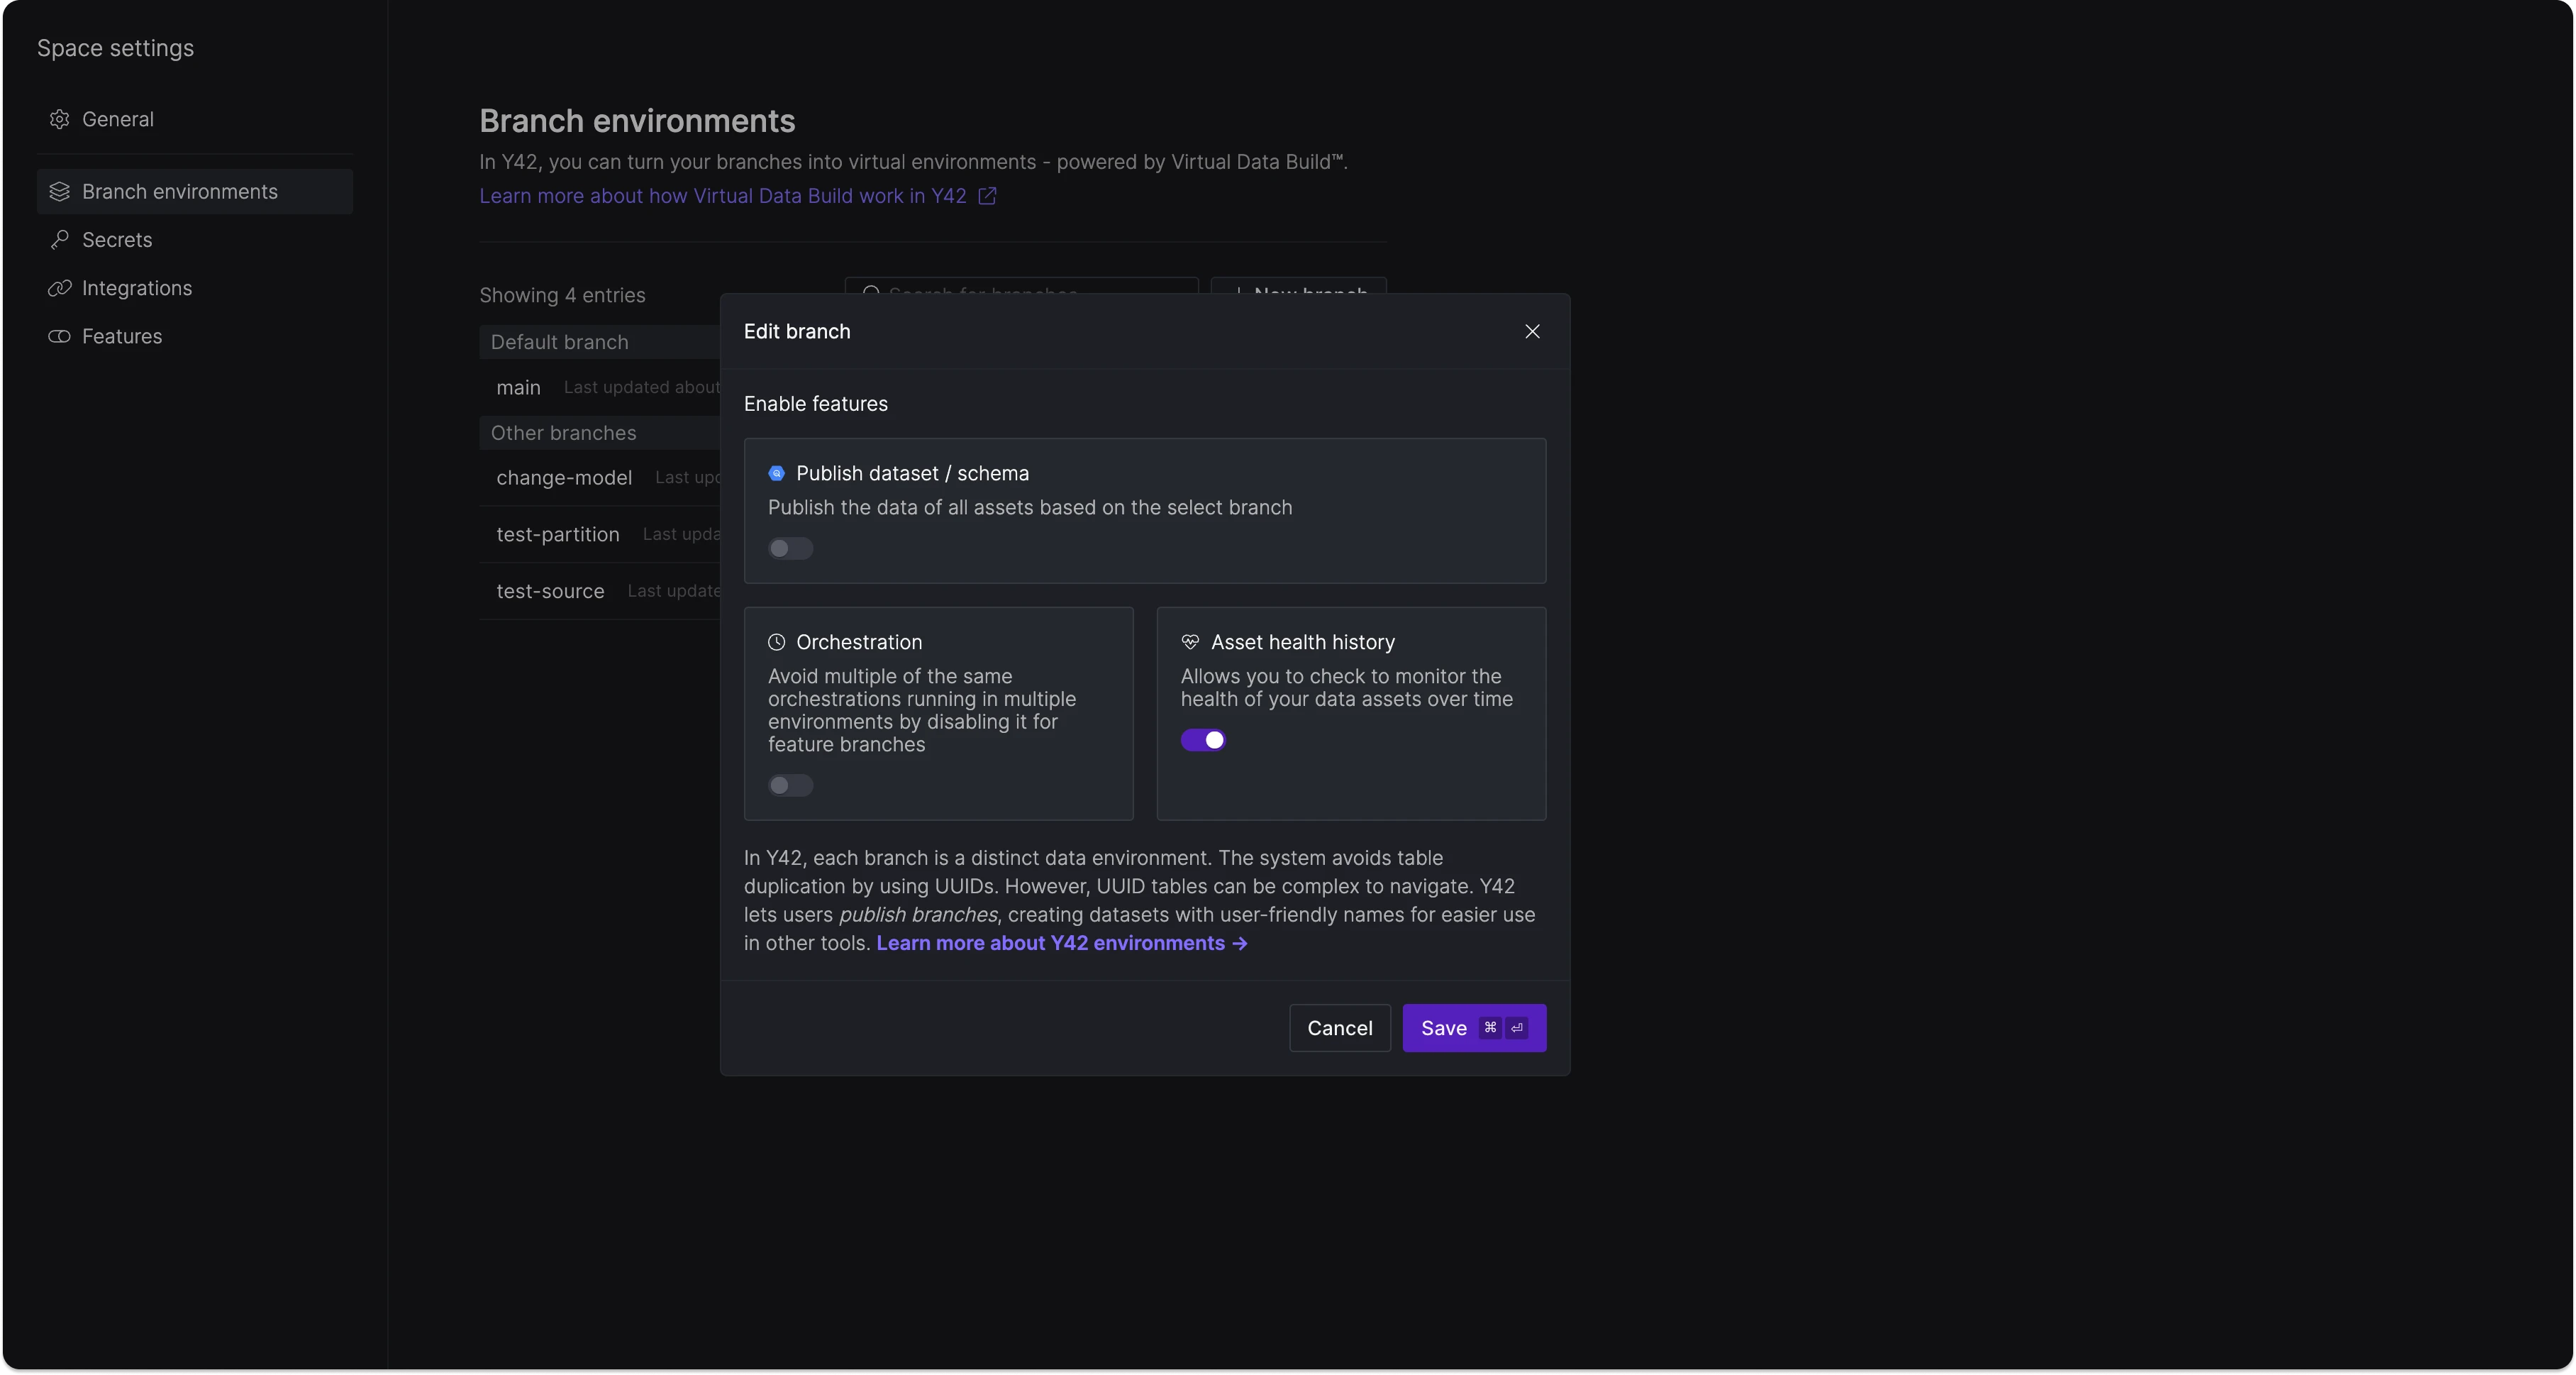
Activate asset health history tracking for any branch via the Branch Environments interface.
After enabling history on your chosen branch or branches, return to the Asset Health History Dashboard to activate it.
Asset Health History Dashboard successfully activated