The Data Must Flow. Reliably.
Y42's Turnkey Data Orchestration Platform gives you a unified space to build, monitor and maintain a robust flow of data to power your business
The status quo
Your data flows are fragmented across a galaxy of tools
start_bash_task = BashOperator(task_id=’tedious’, bash_command='echo "Starting DAG execution"', dag=’unpredictable’); git rebase -i e1234ab pick a5678cd yolo commit; if __name__ == ‘__main__’: # PEP-8 unsafe data = fetch_data(wasteful) ?? with base as (select * from {{ source(‘expensive’, ‘fizz_bang’) }} where date = ‘{{ execution_date }}’;
Tedious
You're bogged down by maintenance work that has little business impact.
Unpredictable
When one part fails, you have no idea how it affects other processes.
Wasteful
Your version control workflow involves re-building the same tables over and over again.
Expensive
You have no clue which steps are actually driving up your cloud data warehouse costs.
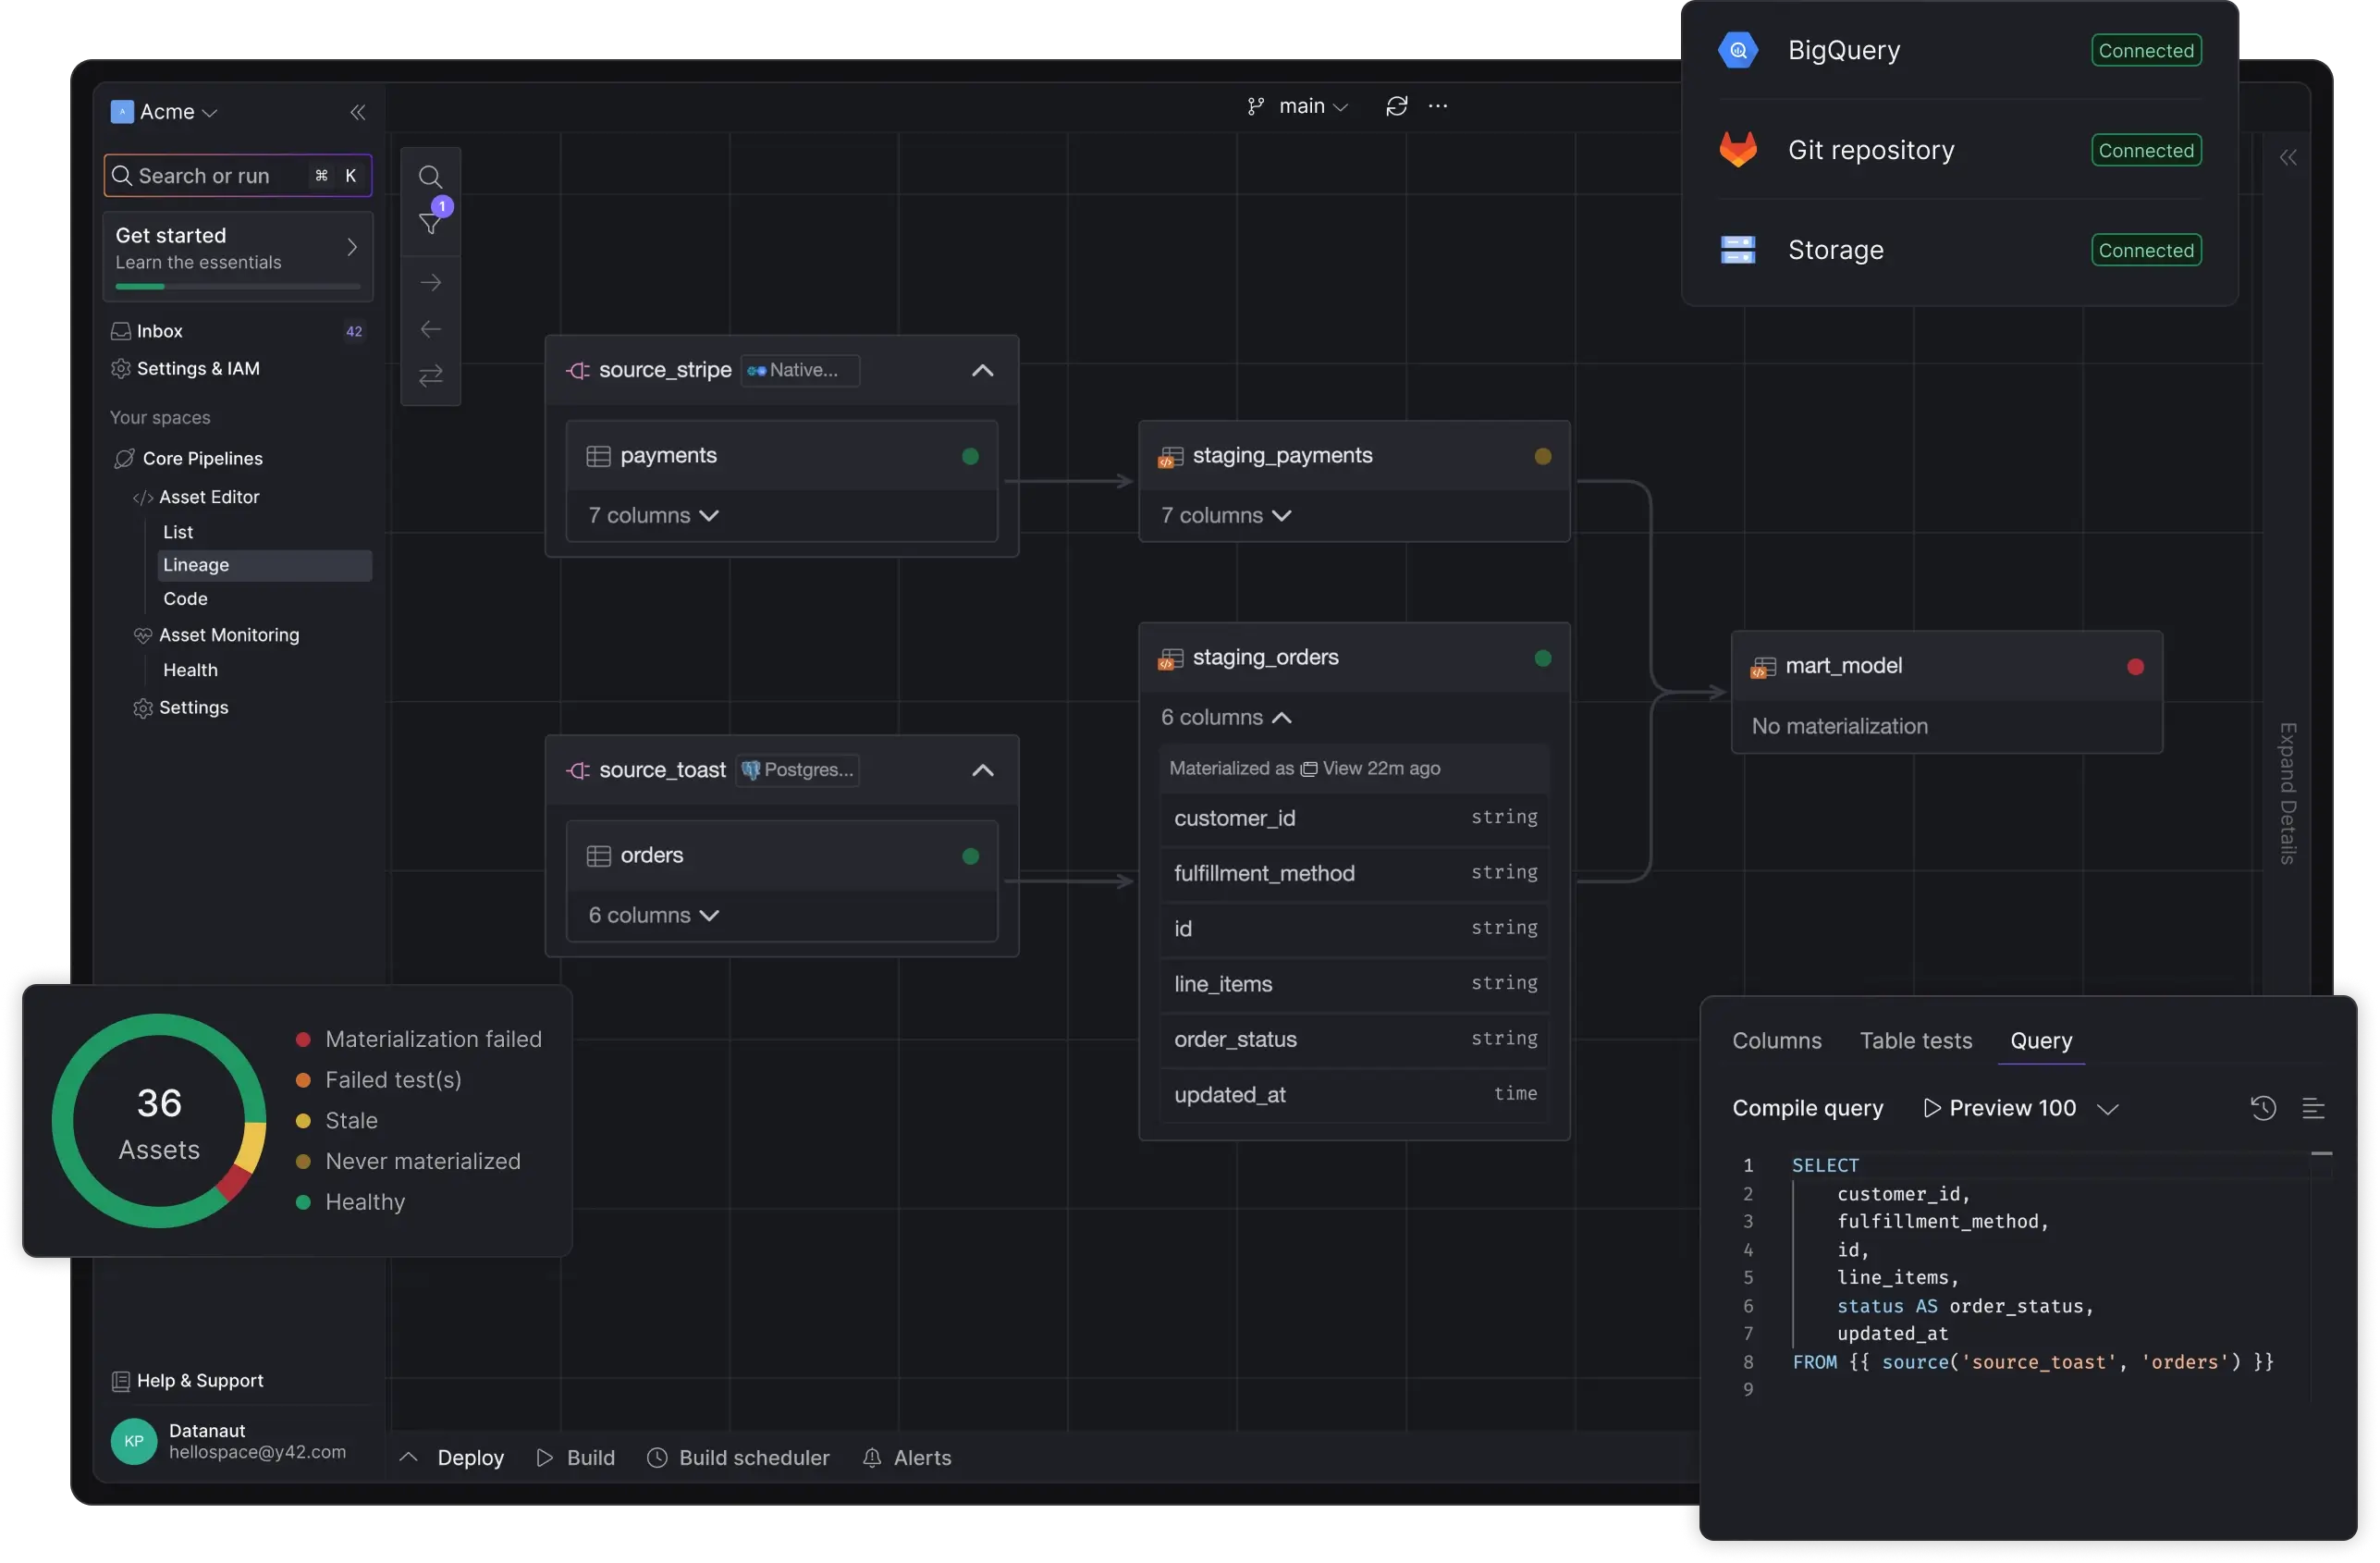
Introducing Y42
The only Turnkey Data Orchestration Platform
Dive into data, not infrastructure.
Designed for data practitioners