
📖 Data Diff lets you compare two assets or two snapshots of the same asset to identify changes at the row and column level—whether they're updates, deletions, or additions. This detailed comparison helps in debugging by allowing you to see how data changed from snapshot to snapshot or in developing new features by comparing the production version with your modified version. Additionally, Data Diff plays an essential role in code reviews by providing reviewers with code and data diffs side by side.
Building reliable data pipelines isn’t easy -- even though the pipeline runs successfully, the data might still be incorrect. The fastest solution is to perform simple count checks between source and target or preview a handful of rows at a glance to infer the health state of a data asset.
If you can dedicate a few more hours, you might add data quality tests to examine aspects such as null percentage, the lower and upper boundaries of each column value set, or referential integrity. This helps quickly identify any major flaw you might have at a columnar level.
Next, you might want to review some assumptions you or your stakeholders have about the data and write some unit tests—these are great for testing complex transformation logic in isolation or edge cases. For example, what would my CASE WHEN statement or regex transformation output be given X, Y, and Z as input?
select
  regexp_like(customers.email, '^[A-Za-z0-9._%+-]+@[A-Za-z0-9.-]+\\.[A-Za-z]{2,}$') as is_valid_email_address
unit_tests:
  - name: test_is_valid_email_address
    model: dim_customers
    given:
      - input: ref('stg_customers')
        rows:
          - {email: cool@example.com}
          - {email: cool@unknowncom}
    expect:
      rows:
        - {email: cool@example.com,    is_valid_email_address: true}
        - {email: cool@unknowncom,    is_valid_email_address: false}
Credit: dbt unit tests
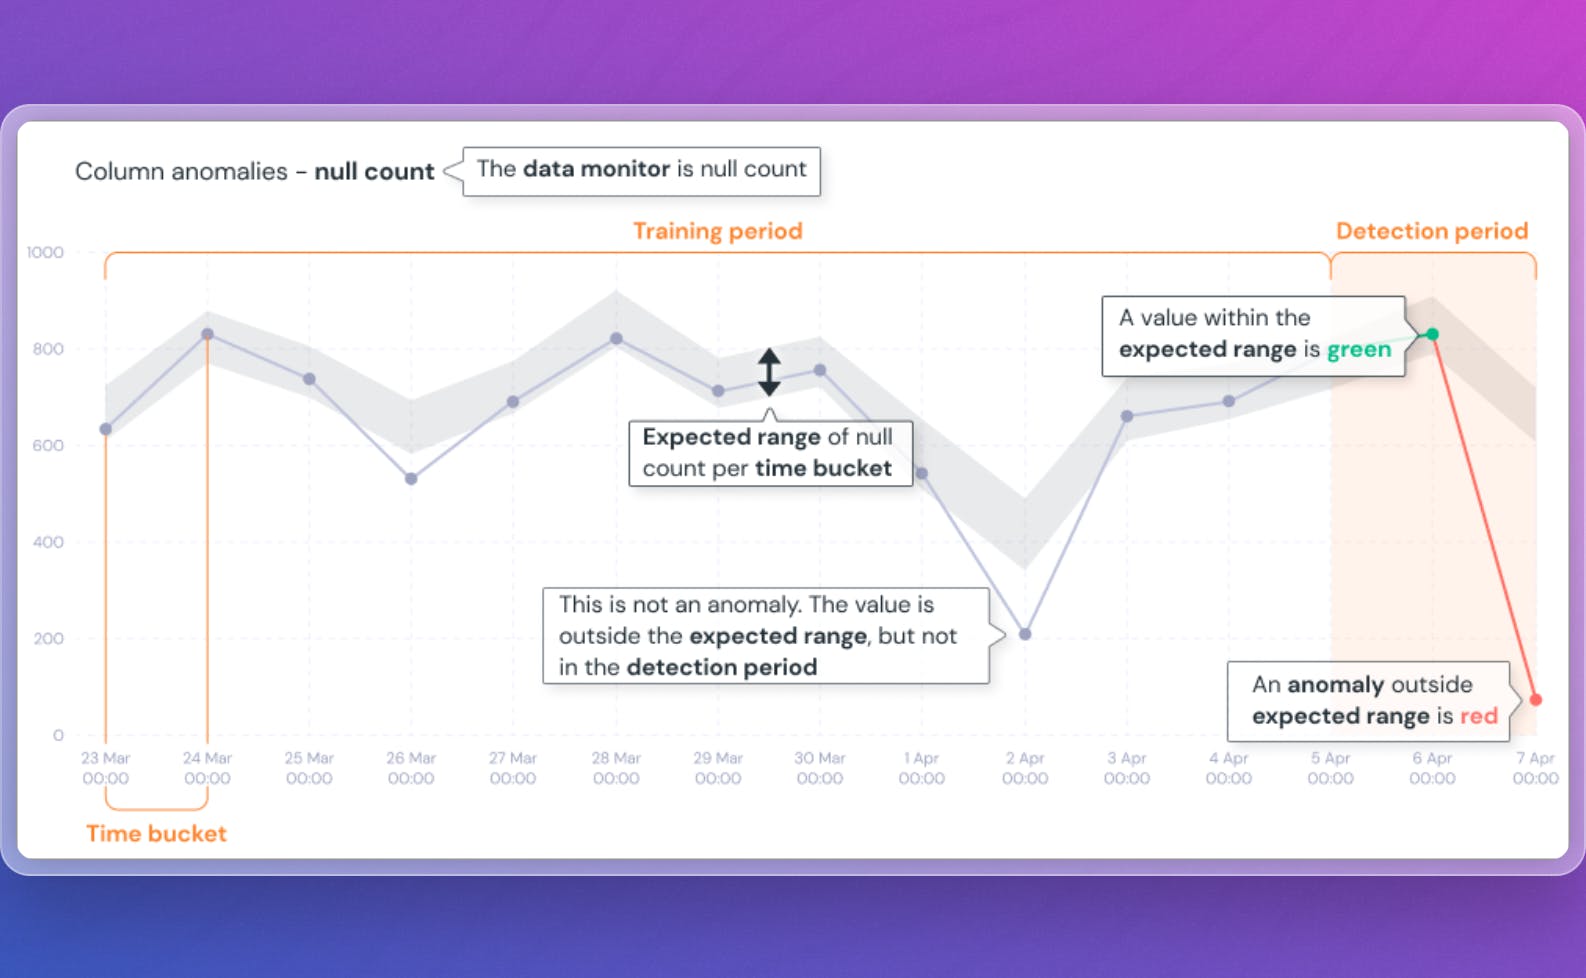
Lastly, if your manager understands the importance of data quality, you might add anomaly detection tests to check for things like source freshness—i.e., how stale is my input data—or volume tests—monitoring the row count of a table and checking if there is a significant difference in row count based on historical data.
Credit: Elementary data
But even after setting up all of the above guardrails, there might still be a lingering unease when changes are made to your data assets.
Introducing: Data Diff - Time Travel for Data
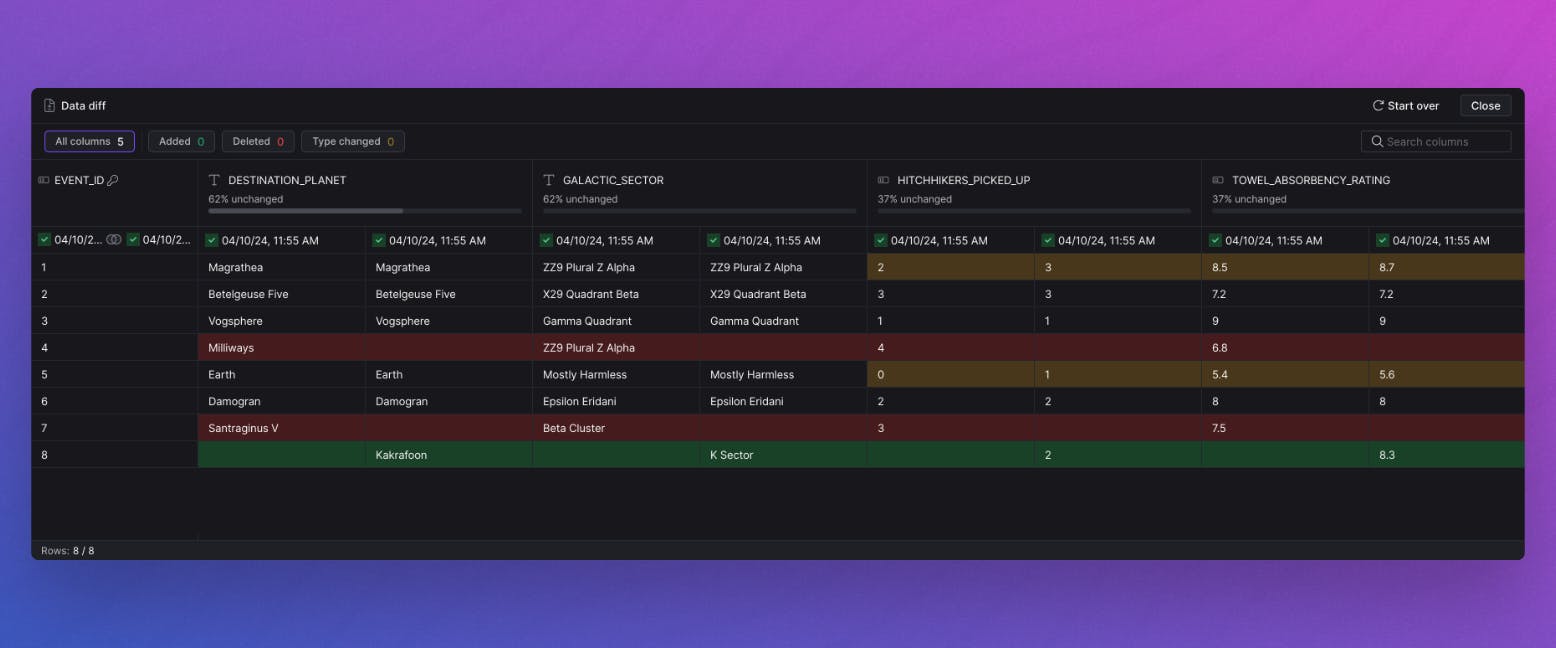
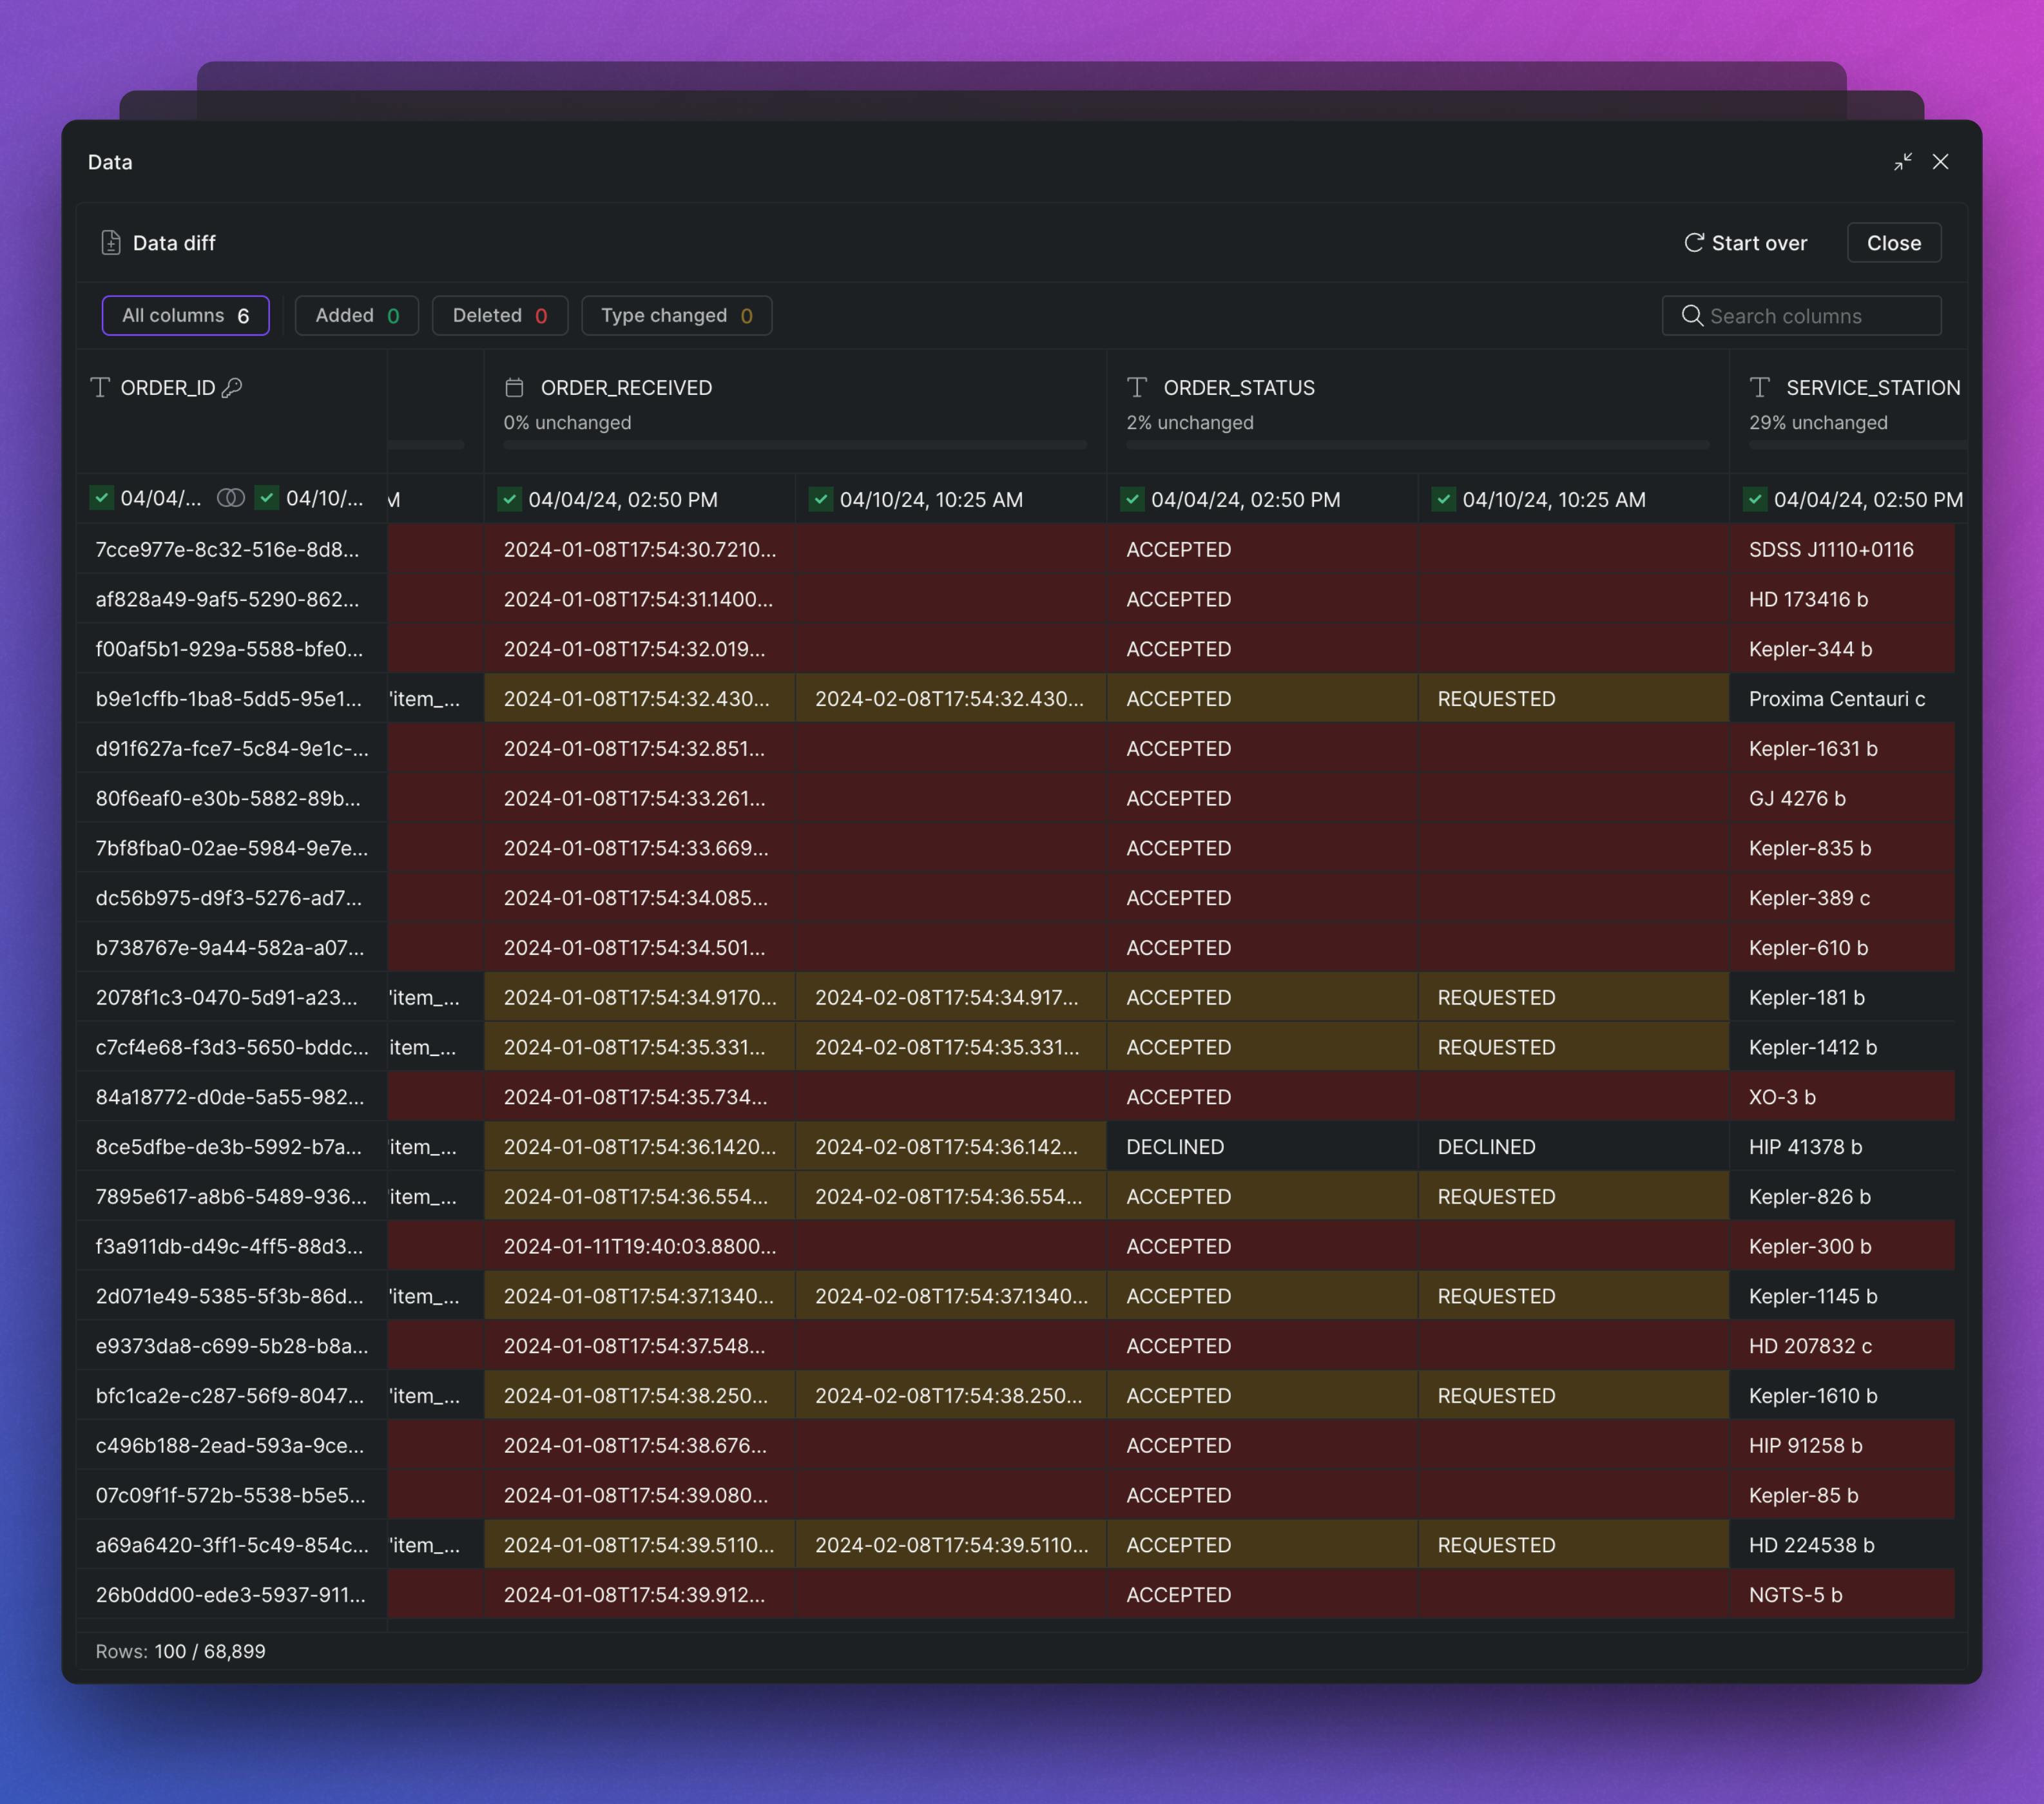
Data Diff involves comparing two tables (or two versions of the same asset) to detect changes and provide asset-level insights. For instance, after a transformation or set of transformations is applied to a table, it determines how many rows were added, deleted, or updated. In addition, it shows the before-and-after values for every value changed on each column.
Y42 is the only platform that allows you to run Data Diff in all three scenarios:
- 🧑💻 When Developing: You can preview how the values change while you apply your transformations and conduct spot-checks to validate business use cases.
- ⏩ When Reviewing Others’ Changes: When someone creates a Pull Request (PR) to introduce a change, data and code diffs are displayed side by side.
- ⏪ When Analyzing Past Data Changes: Even if no code changes are applied, the data still changes with every refresh. Y42 is the only platform that allows you to compare an asset's previous run with the current version—or any other version—to see how the asset has changed over time, thanks to its Virtual Data Builds mechanism.
Data Diff in Y42 functions like Time Travel for Data: it allows you to rewind to compare datasets alongside earlier versions, and fast-forward to see the future impact of your changes before approving code changes.
Data Diff when Developing
🧑💻 See the impact live as you make changes.
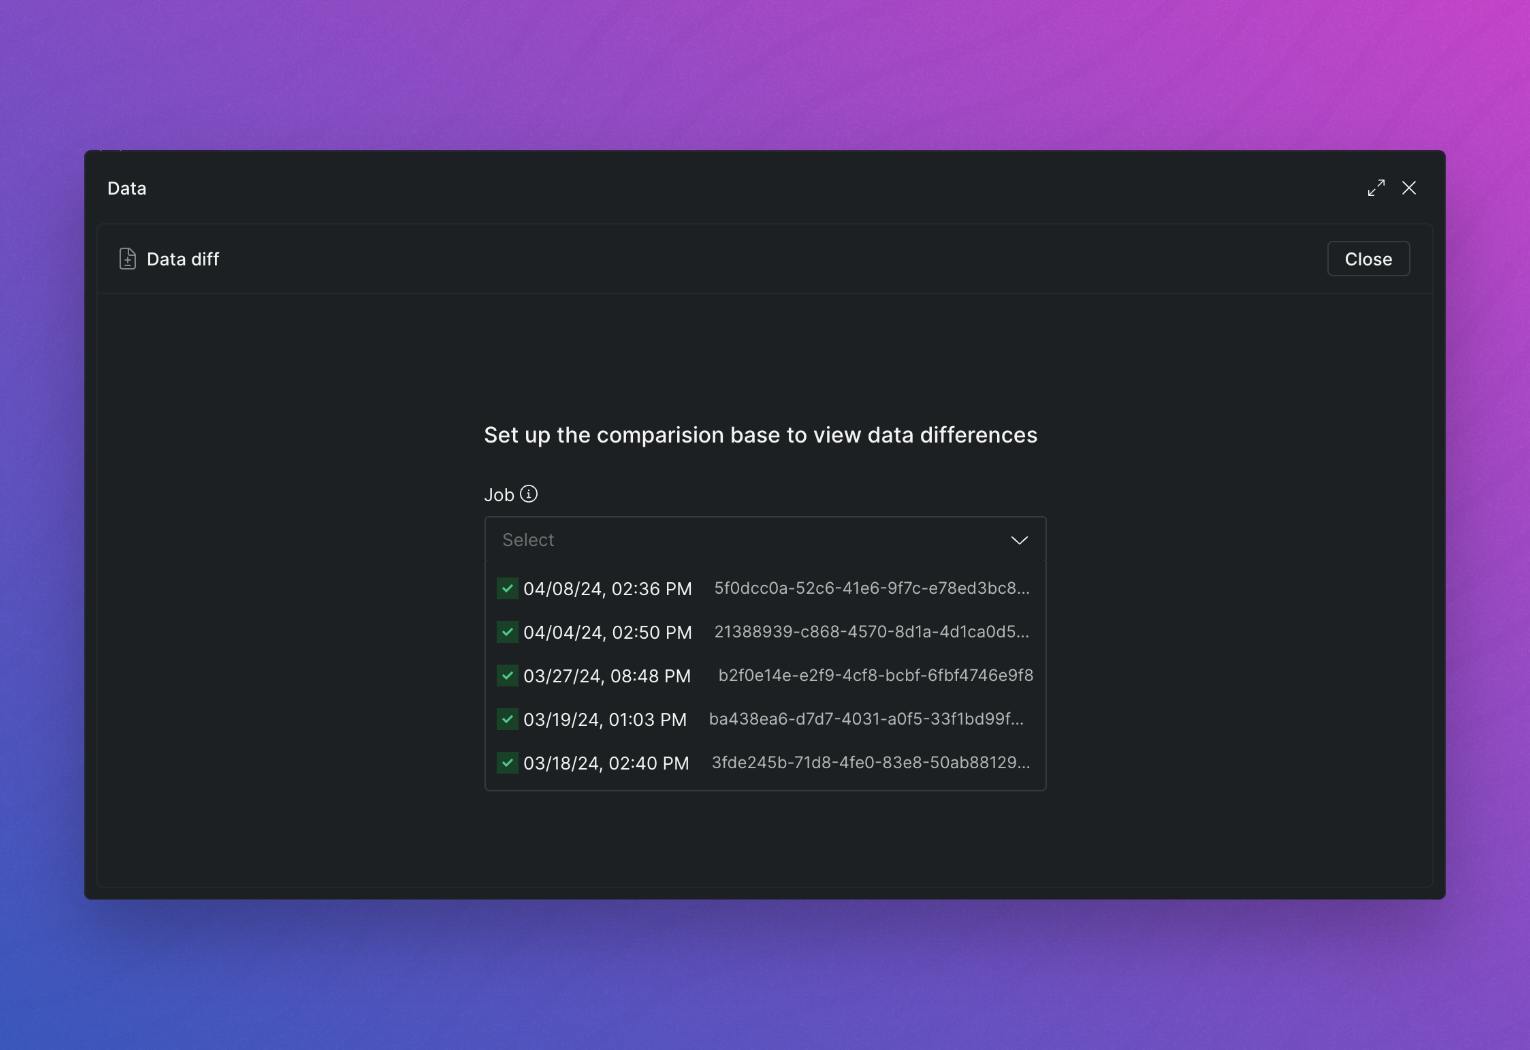
Any time you make changes to your data models, you can compare the current view with any previous snapshots to see the impact of your code changes. Select from any previous snapshots to compare to, not only the last one available.
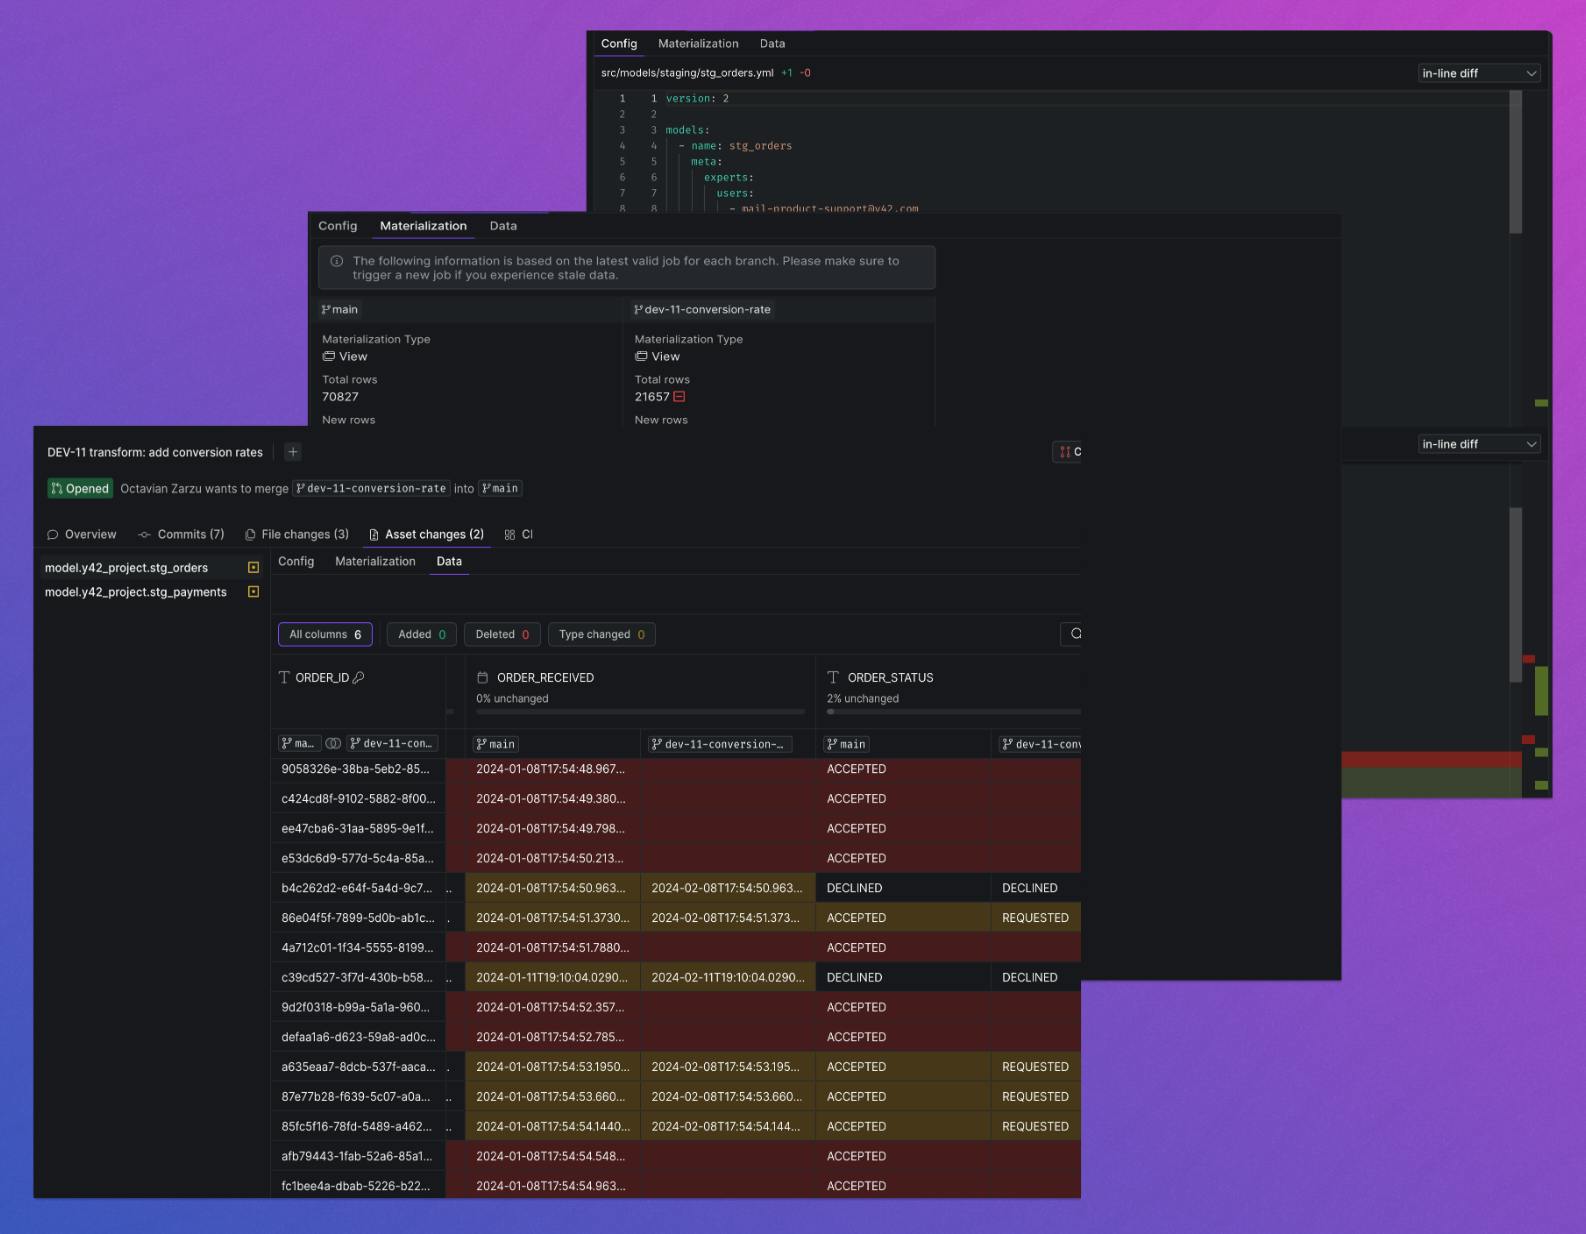
Data Diff when Reviewing Others’ Changes
⏩ Fast-forward to see the future impact before approving changes.
Reviewing code changes can be difficult without context. Data Diff simplifies the process by seeing the code and data diffs displayed side by side. If the code changes make sense, you now have a visual representation of how the asset will look once the changes are implemented.
Data Diff when Analyzing Past Data Changes
⏪ Rewind to compare datasets alongside earlier versions.
With Data Diff in Y42, you can also take any two previous snapshots of a dataset—for example, the current version and the previous one, or any other two—and see how the data has changed between those two points. Datasets are living entities that continuously change over time as new data comes in or code changes are applied. So, even when no code changes are applied, the dataset still changes.
Being able to compare versions of the data from earlier refreshes side-by-side alongside the existing dataset is very valuable as it helps explain what happened - teams often spend time on wild goose chases wondering if the latest version is valid or not. It’s possible no tests were failed or anomalies detected but the downstream consumers just don’t trust the data as they feel there’s something quirky they can’t put their finger on. DataDiff allows them to do that.
This is possible because of Y42’s Virtual Data Builds – a two-stage layer approach:
- An internal layer that contains all asset materializations
- A customer-facing layer that points to the latest materialization from the internal layer, ensuring your users access the most recent, healthy data.
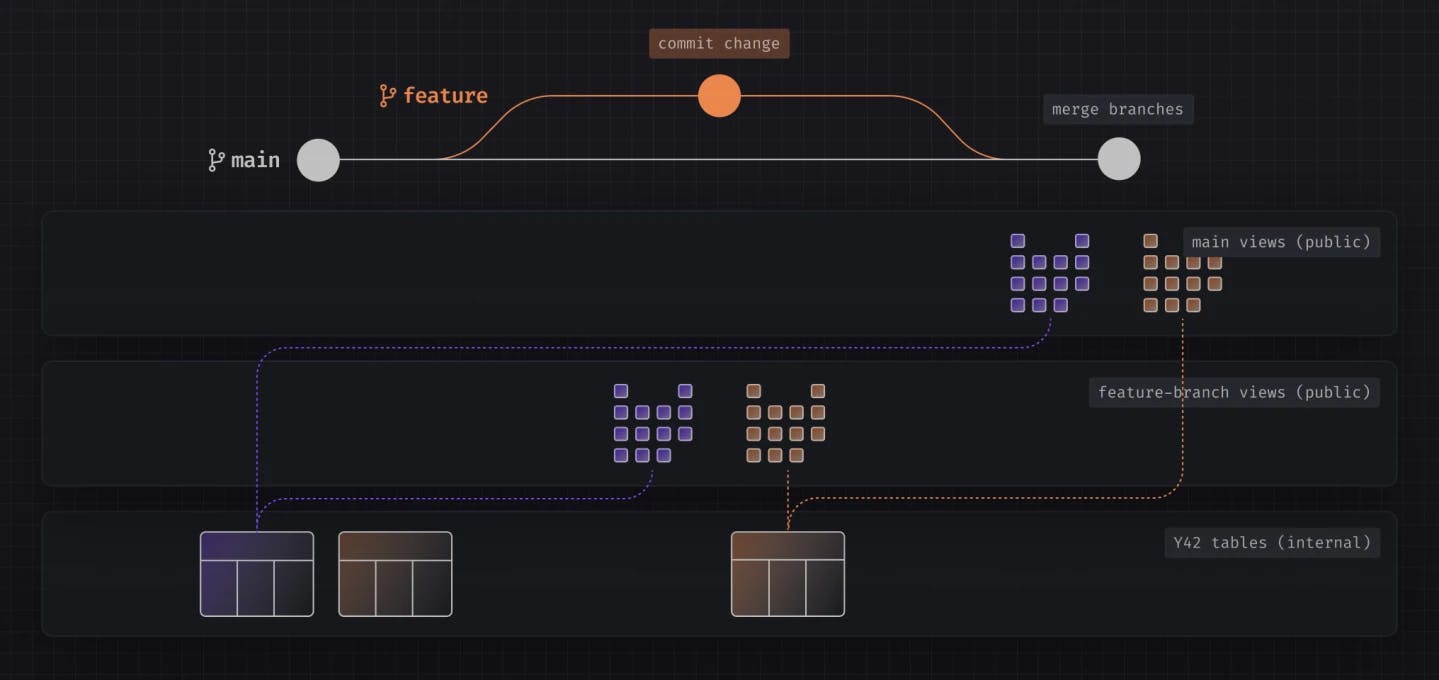
Each materialization in the internal layer is tied to && in your codebase, meaning you have a direct link between each asset materialization and a specific code. This link simplifies deploying new changes or rolling back to a previous state. For example, whenever a code change is deployed or rolled back, the pointer in the customer-facing layer is updated to reflect the respective materialization from the internal layer that corresponds to the Git commit. This means you get zero-copy deployments and rollbacks, ensuring that you can manage and trace all materializations of an asset without having to navigate through complex pointer structures manually.
🆕 Materialization refers to the process of bringing data into a solid, query-able state. Within data workflows, this typically means transforming raw data into a more structured, accessible format stored in a database or data warehouse. This transformed data is what we refer to as a 'materialization.' It's a tangible output of the data processing pipeline, usually a table, serving as a foundational layer for analysis, reporting, and further transformations.
Zooming out: A Better Workflow
Data Diff allows you to build and deploy data pipelines with greater confidence, knowing that you can spot differences at a row level for each column every time a transformation is applied. As we have seen, with Data Diff in Y42, you can also compare previous snapshots of the same asset, allowing you to identify what changed between data refreshes, even if your codebase hasn’t changed.
Knowing that you can perform a data diff and see the changes at every layer of your pipeline is extremely powerful, and this wouldn’t be possible without an end-to-end solution like Y42. It introduces a new visual and checkpoint-based way to debug data pipelines that was not possible before. For instance, suppose your pipeline fails due to a bad data transformation at one of the final layers. Debugging such cases can be challenging – tracing the origin of the wrong data and understanding why it wasn’t filtered out if complex joins are involved, business logic and filters are applied. But now, with Y42, you can trace and compare data at each previous step using column-level lineage, zero-copy rollbacks, and data diff. Similar to how software engineers use checkpoints to see when code breaks.
🔥 Data Diff, coupled with Column-Level Lineage and Virtual Data Builds – the technology that allows you to store all previous snapshots of an asset and automatically point to the one where your commit head is, enables you to debug data pipelines visually by adding checkpoints at each step of the pipeline and comparing the before-and-after snapshots of an asset. This shifts debugging from line-by-line code analysis to visually exploring data step-by-step, allowing you to review and compare current and past versions.
Benn Stancil refers to this approach of validating the accuracy of business metrics as Method 2:
Start with the metric and trace backwards, through its entire lineage graph, through every prerequisite calculation and transformation, through every upstream table that sits behind it, all the way to the every source system of record that logged each original data point, and validate that, at each step of the computational process, every event is recorded, and every test is passing. [..]
Check if historical values of the metric are the same today as they were yesterday.
As data people, we seem to favor the first approach. We create data contracts that catalog what we expect source data to look like when it arrives in our warehouses. We build observability tools that constantly monitor that data for outliers. We write tests in dbt that confirm dates are dates, numbers are numbers, and unique keys are unique. We set up alerts that tell us when a pipeline stalls, when a job errors out, or when we’ve hit Marketo’s API limit and can no longer sync marketing data into Snowflake.
[..]
everyone else uses Method 2: “Do I believe this number, given what I believed yesterday?”
We do this so instinctively that we often don’t even notice. When I put together board decks, the most nerve-wracking moment was comparing the metrics in this quarter’s deck to the same numbers in last quarter’s charts. Nothing turns your stomach over faster than realizing you’ve accidentally revised all of your historical ARR figures. Conversely, there’s no better feeling than seeing all the graphs line up, and confirming that what you thought was true then is also what you think is true now.
At Y42, we are committed to improving and redefining the data workflow by integrating sources and models through a unified YAML-driven platform, declarative and stateful assets, transforming the code review experience, and embedding tools like anomaly detection and data diff to streamline, build, and manage pipelines confidently.
Category
In this article
Share this article