
Chart-based reports, when done well, are a powerful way to share data-driven insights. However, as your chart-based reports become more complex and draw from a greater field of data sources, there are many common pitfalls in design, format, decoration, and ratios that trip up even the most experienced analysts.
We’ve compiled some simple but effective principles that ensure you create the most accurate and compelling data charts. Many of these principles can also be found in data literature, notably Edward Tufte’s book, The Visual Display of Quantitative Information.
Make the data the star of the show
The insight you are trying to convey should have much greater weight than the process you went through to arrive at your conclusion. This means that you should try to:
Display an accessible level of detail
It’s important not to pack the charts with an overwhelming level of detail. For example, some data charts contain so many labels that the graph underneath loses the prominence that it was supposed to have. There are creative ways to pack the right amount of information into your chart and present a great deal of data in a small space without losing impact. Consider elements such as where a line starts and where it ends, and having well-spaced gridlines.
The area of a bar or pie chart, as well as the size of a bubble in a scatter plot, are all ways to pack information more densely. For example, Hans Rosling’s famous scatter plot about the world population’s progress over time is extremely information-dense and a great example of visual storytelling. Even if you do not have the tools at your disposal to make an animated chart, the principles at work here can be replicated on static data charts.
Encourage the eye to compare different pieces of data
Deploying different colors and forms into your chart will ensure that the viewer is drawn to your prioritized elements. Consider using methods such as varying lengths and widths, changing the shape of data points to differentiate between them (e.g., triangles versus circles), experimenting with enclosure and orientation, and manipulating shapes with blurring and curvature.
The subconscious process through which the brain takes in visual information is called preattentive processing. There are several great resources available from the Interaction Design Foundation that will enable you to dive into the science on a deeper level and make your findings stand out.
Present lots of numbers in a small space
Ensuring you fit all relevant data in can sometimes be a challenge, particularly when your chart requires that you present many numbers in a small space. Boxplots, violin plots, and stacked densities are great ways to overcome this challenge, each visualization with its own strengths and weaknesses. Below is a strong example of a violin boxplot:
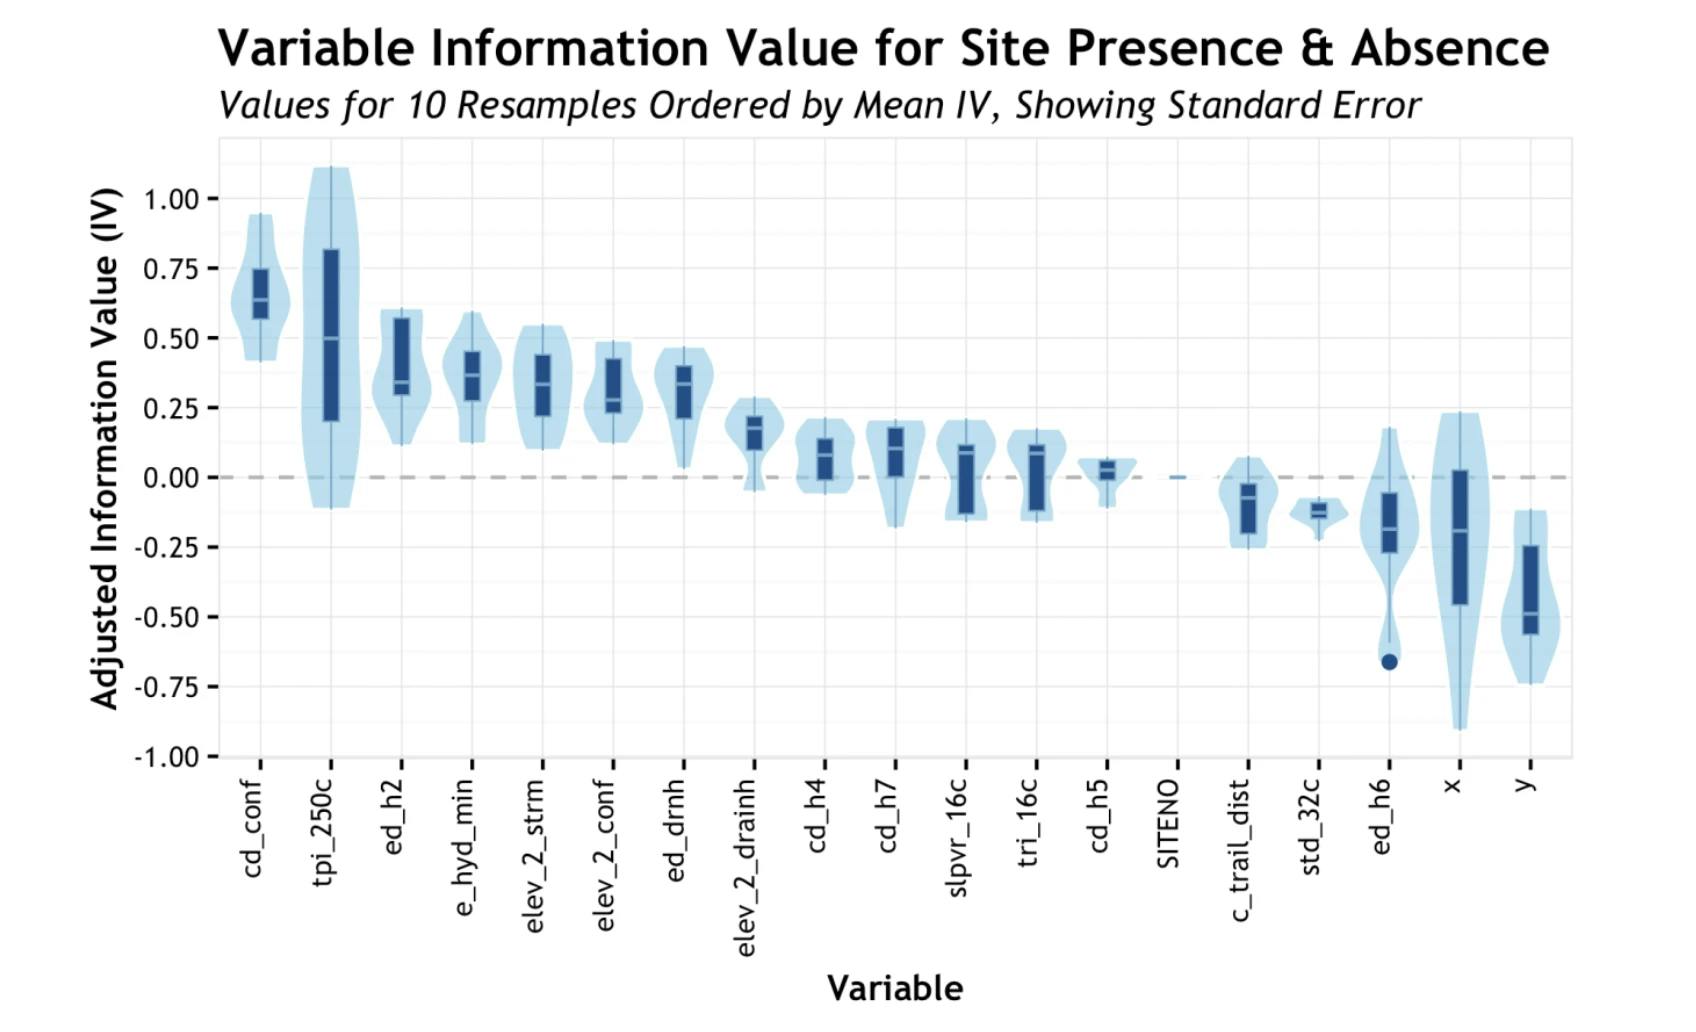
Source: Boxplot or not boxplot: Woe-full example
Closely align design and description
Choose the most relevant format and design for your chart, especially one that is compatible with the kind of data results you’re presenting. For example, bar and pie charts lend themselves best to categorical data, while a line chart works best with continual data. In addition, displaying information in a rectangle with proportions somewhere between 1:1 and 1:2.2 makes it easier for the viewer to process. However, there is more to a great chart than just choosing the right format and proportions.
Optimize the ink-to-information ratio
Use fewer lines to tell the same story so that everything the viewer looks at is immediately useful and informative. For example, don’t add dots and hatches to fill in a chart; a block color (for example, plain blue) or empty fill can be just as effective.
The use of less ink to allow users to capture more information in one glance is clearly displayed in this comparison of data charts by Kevin McGurgan. Note, however, that once you get below a certain ratio (as seen when you compare “medium” versus “high” data–ink ratios), less data-literate consumers may get easily confused.
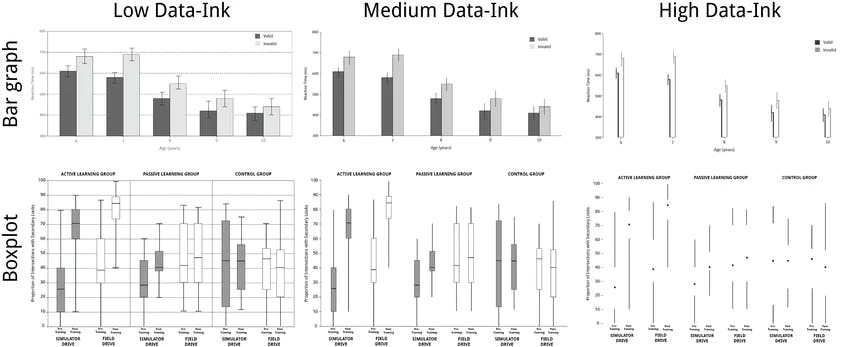
Source: Data–ink Ratio and Task Complexity in Graph Comprehension
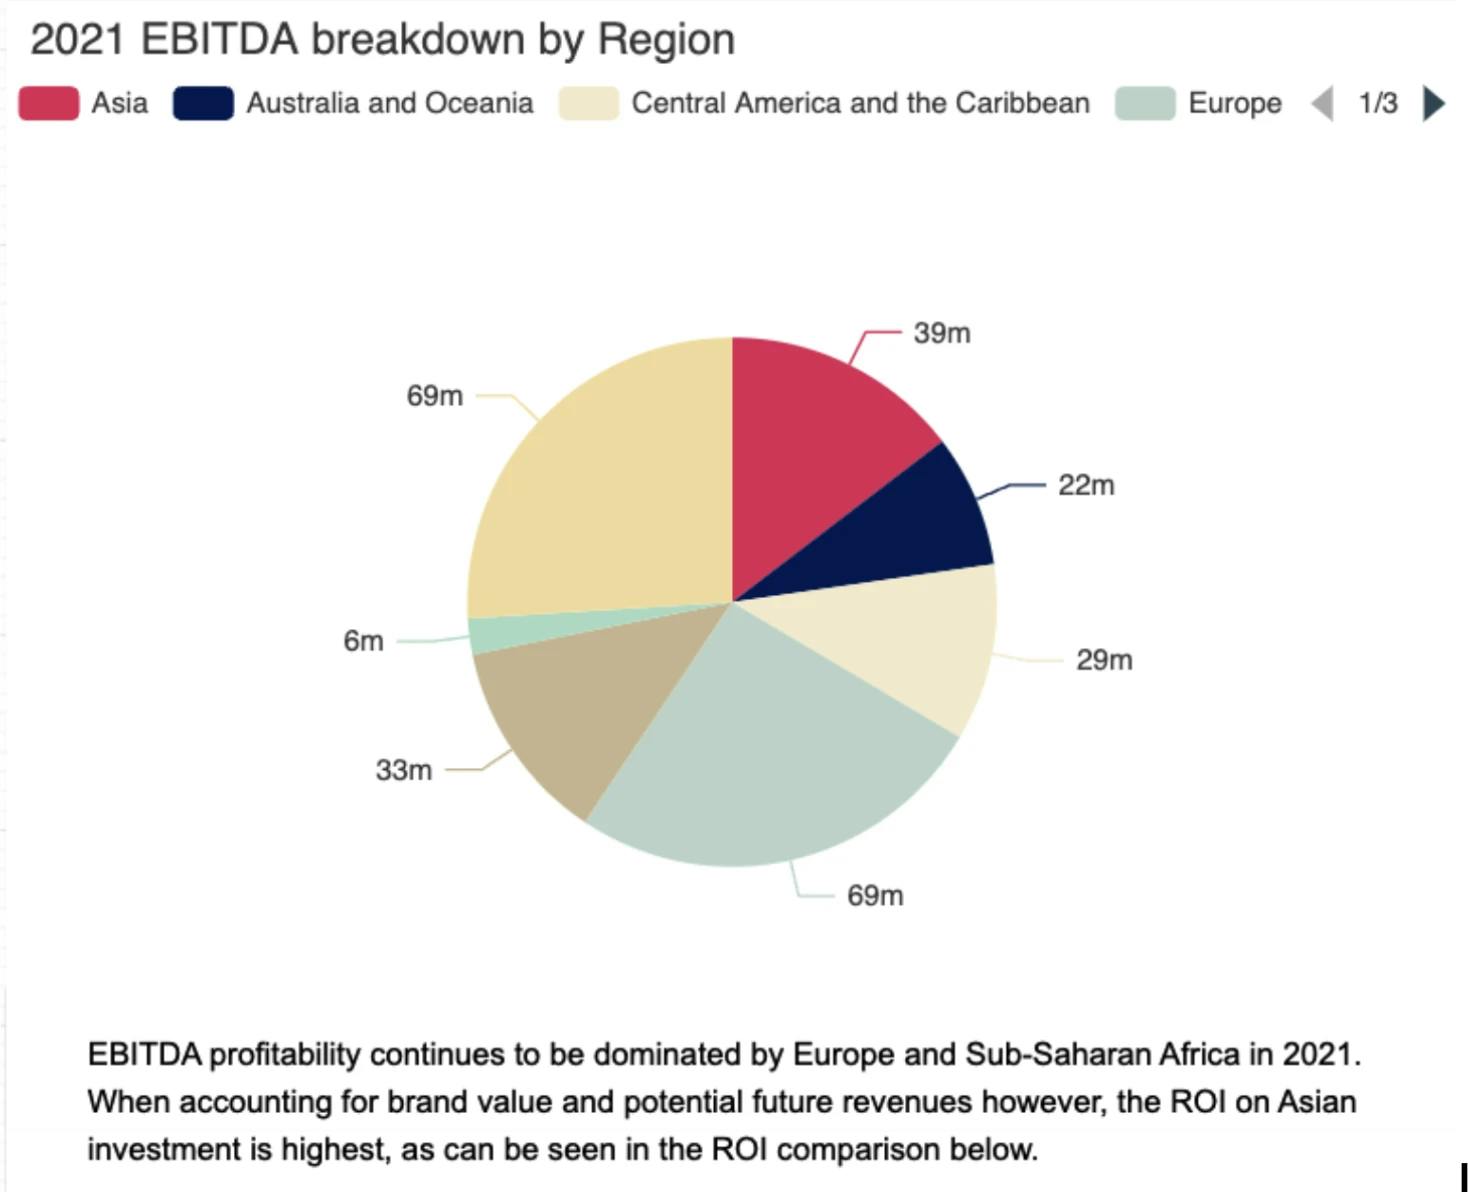
Align the statistical and verbal descriptions of a data set
Written descriptions are an essential part of conveying a message with data, whether your audience is less data literate and needs help with interpretation, or you are trying to weave together a data story to draw a powerful conclusion. For example, the pie chart below could be a good first step in telling the story of the emergence of Asia as a growth market for a particular company.
(Mostly) Avoid content-free decoration, including chartjunk
Are you guilty of “chartjunk”? It can be tempting to make your chart-based report seem more interesting by saturating it with unnecessary visual or presentation elements, which often aims — and fails — to hide weak data. Chartjunk can range from off-topic visuals to over-the-top illustrations, as well as attempts to add two contrasting data sources into one graph.

Source: Chart Junk Considered Useful After All
This is perhaps one of the more famous examples. The chart itself is certainly memorable, but not for the right reasons. A viewer is likely to come away remembering the visual, but not the information that surrounds it.
Note, however, that the use of images to accompany data charts can be useful when they help to accentuate the correct understanding of a chart.
Reveal several layers of detail, from the broad overview to the fine structure
Advanced coding for charts has made it possible to reveal several layers of detail through interactive and in-depth layers of information. Two of our favorites are:
Tooltips
Using tooltips is an interactive and engaging way to reveal layers of information. When viewers can hover over a data point and receive more information, they are more likely to absorb the insight you are trying to convey.
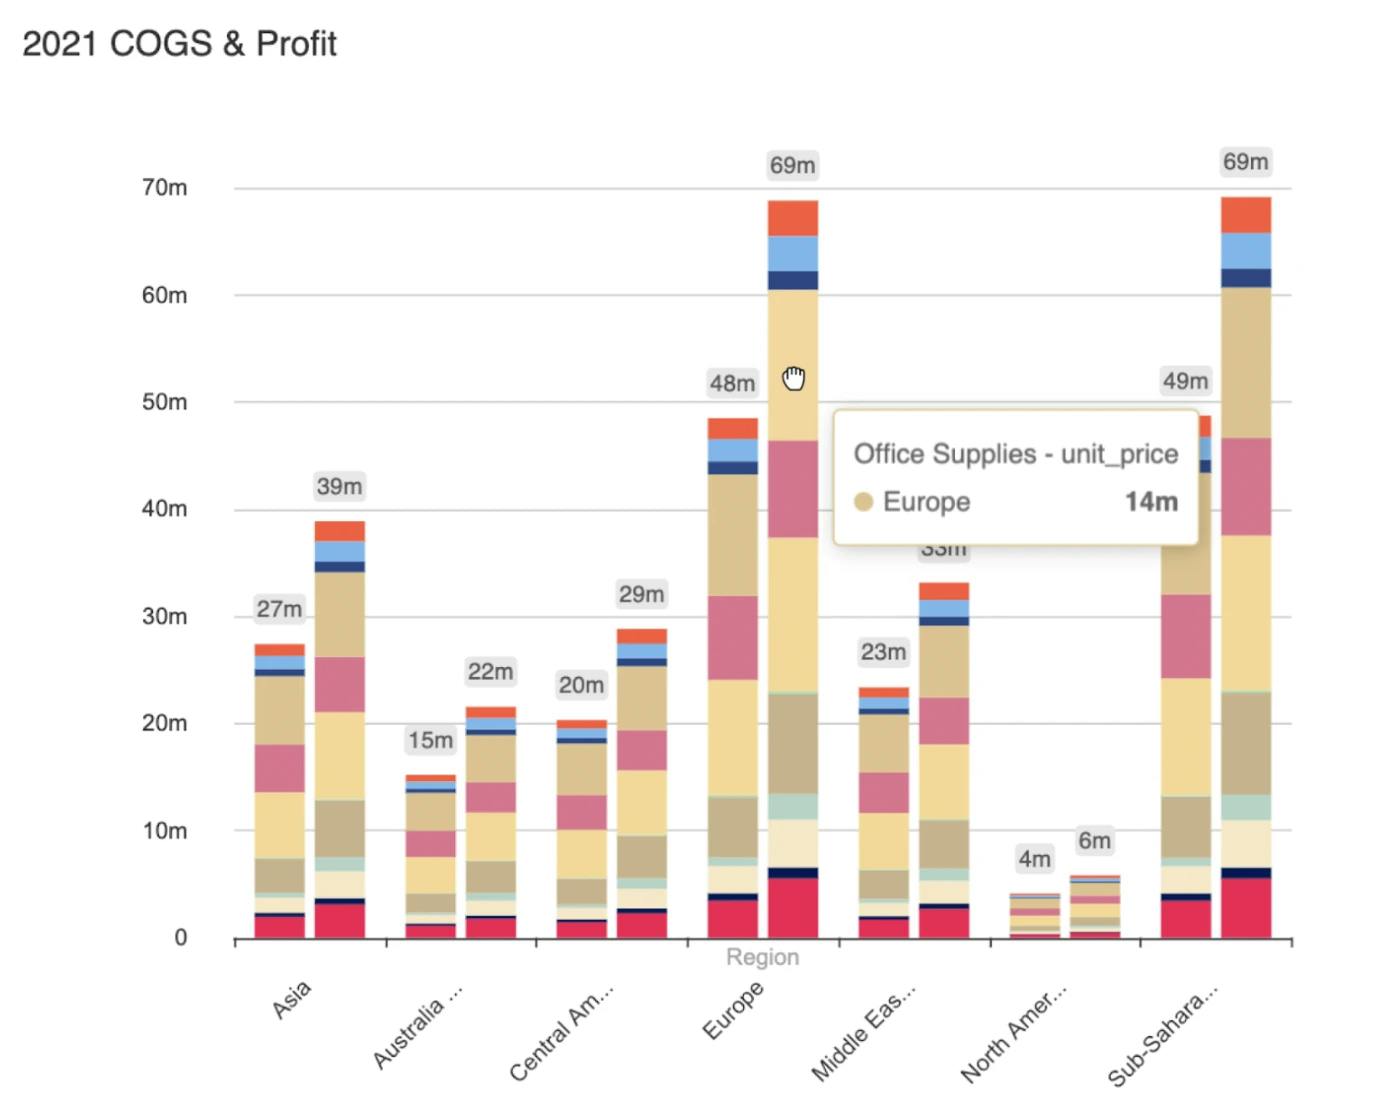
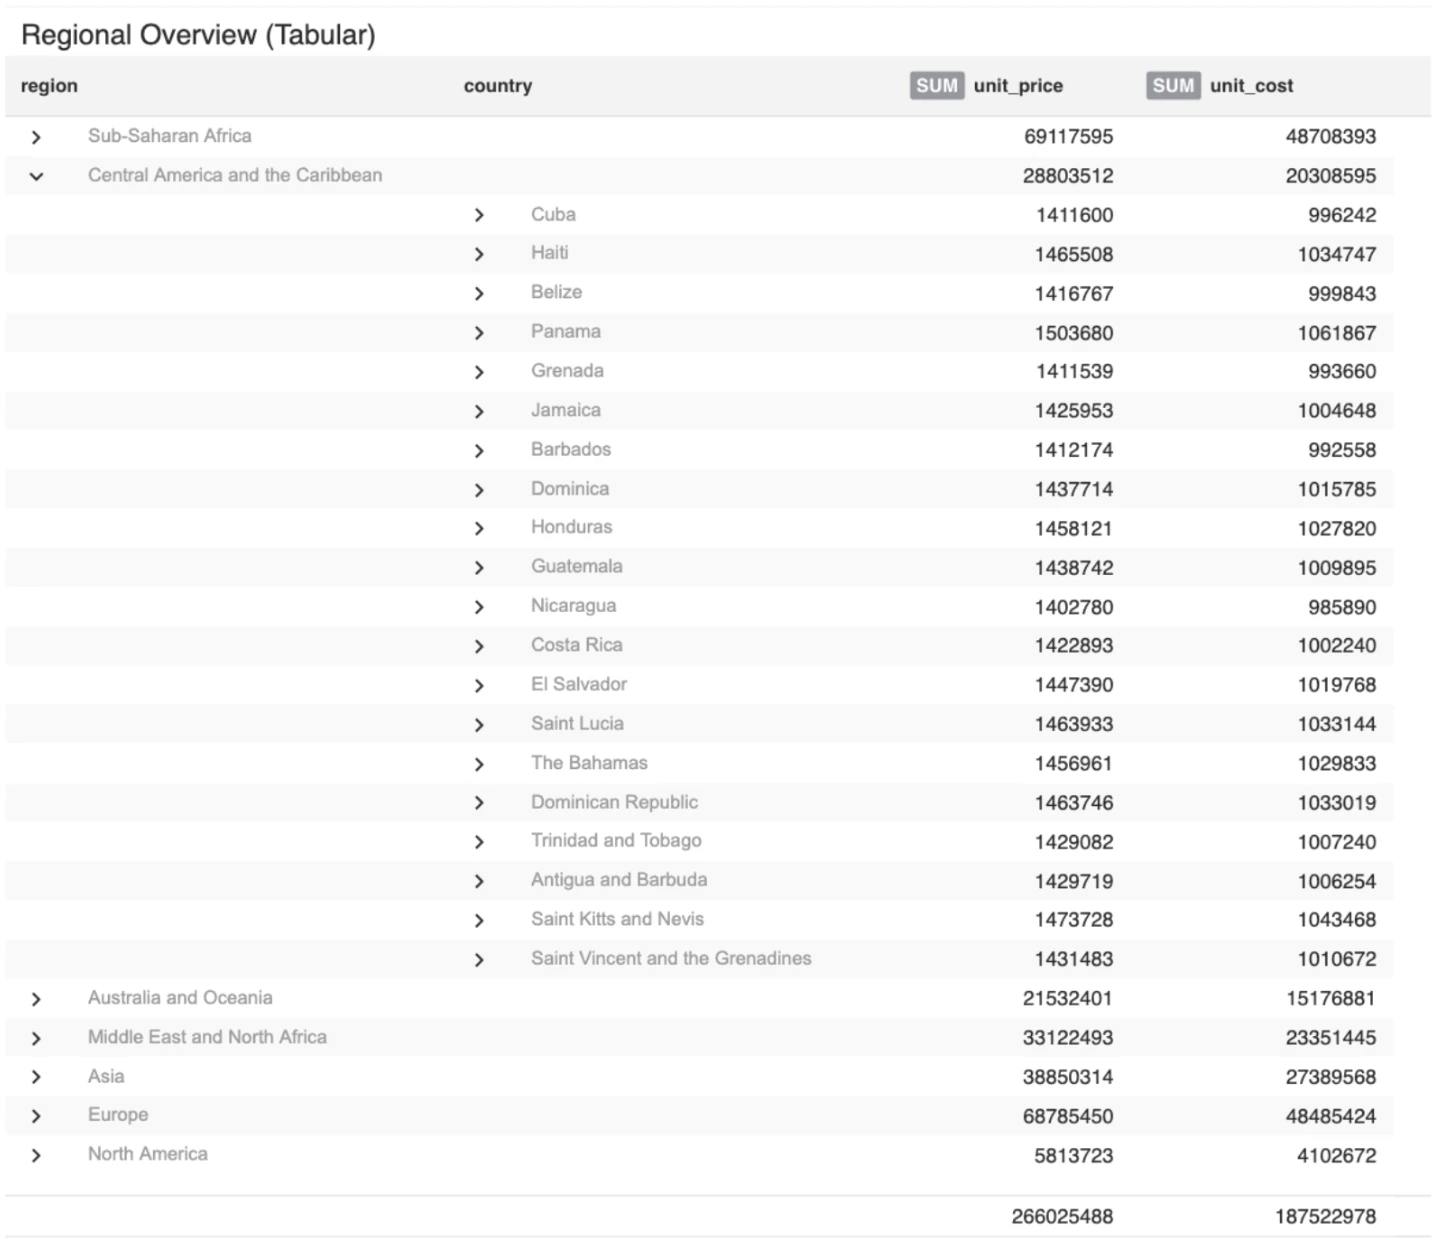
Tables with totals and subtotals
These kinds of tables reveal both the bigger picture and the granular detail. For example, a global sales table can show a global total, then be broken down by region and show regional subtotals, and then individual values by country.
Avoid distortion
Data is sometimes easily distorted in its interpretation (there are some analysts who even deploy distortion techniques deliberately). There are several ways to avoid data distortion.
Keep your scale proportionate to the data
Don’t try to make changes or shifts in your data to look smaller or bigger than they are on your graph — doing so has the potential to misrepresent your data and convey the wrong results. It is also often deployed when the analyst is attempting to highlight a specific aspect of the data, without accounting for the rest of the numbers. So, keep your visuals to scale to communicate clear results.
Always use a baseline
It can be tempting to start with a number higher than zero as your baseline to make a small difference seem larger, but it is ultimately misleading and will undermine your efforts. Since a viewer’s eyes will process, for example, a bar chart by comparing the varying heights of the bars, starting with a baseline higher than zero manipulates how the brain makes this visual comparison and potentially leads to a false conclusion. Always start with zero.
Don’t omit what you don’t like
Whilst your objective should be clear, this shouldn’t come at the expense of data that suggests otherwise. Again, it will undermine your efforts. If you need to omit data to make your point, then you might be shoehorning a conclusion that cannot properly be backed up. Don’t be afraid of the bigger picture. Even better, use discrepancies as part of the narrative — if results are skewed, for example, then dig into why this has occurred and aim to answer the “why” as part of your results.
Be wary of correlating causation
While drawing relationships between variables can be a powerful part of a narrative, equally, you should be sure that your conclusion is backed up by the most appropriate data. Determining causation can often become an inaccurate guessing game if you don’t use accurate and relevant statistical methods. Regression analysis may not be enough, and you will need to identify independent variables and external shocks in your quest for statistical significance.
What’s more, don’t be tempted to draw from irrelevant sources or data that puts a wholly different slant on your narrative. Let the data lead to the conclusion instead of forcing data to tell a different story. We cover this in more detail under "Be objective and transparent" within our top tips for powerful data-driven storytelling blog article.
Conclusion
Ensuring your data charts achieve their objectives is an art and a science. But these visuals can end up being more confusing than informative when done incorrectly. Remember that your data is the focus, and your aim is to skilfully reveal your findings and help the viewer reach your intended conclusion.
Category
In this article
Share this article