
As a data engineer, you know it’s not uncommon for business users to tell data teams that the data is wrong. Usually, this comes in the form of panic-filled Slack messages. Business users might need to pull a metric for an important project and notice the numbers they are seeing don’t make sense. They reach out to the data team for clarity. This pulls the data team in different directions, needing to answer these questions and investigate the issue further while also balancing their other priorities. For obvious reasons, this causes frustration for both business users and the data team.
It’s important that these issues are worked through to ensure the business still trusts the data you are providing. After all, trust is the most valuable thing in any relationship the data team builds. Without trust, what’s the point of having a data team at all?
The importance of putting systems in place
Unfortunately, it’s quite unhelpful when business users simply tell us “the data is wrong”. That isn’t going to get anything accomplished. To ensure you have the information you need to investigate an issue, you need to make sure you have a system in place for business users to follow.
I recommend creating a system that touches on these key questions:
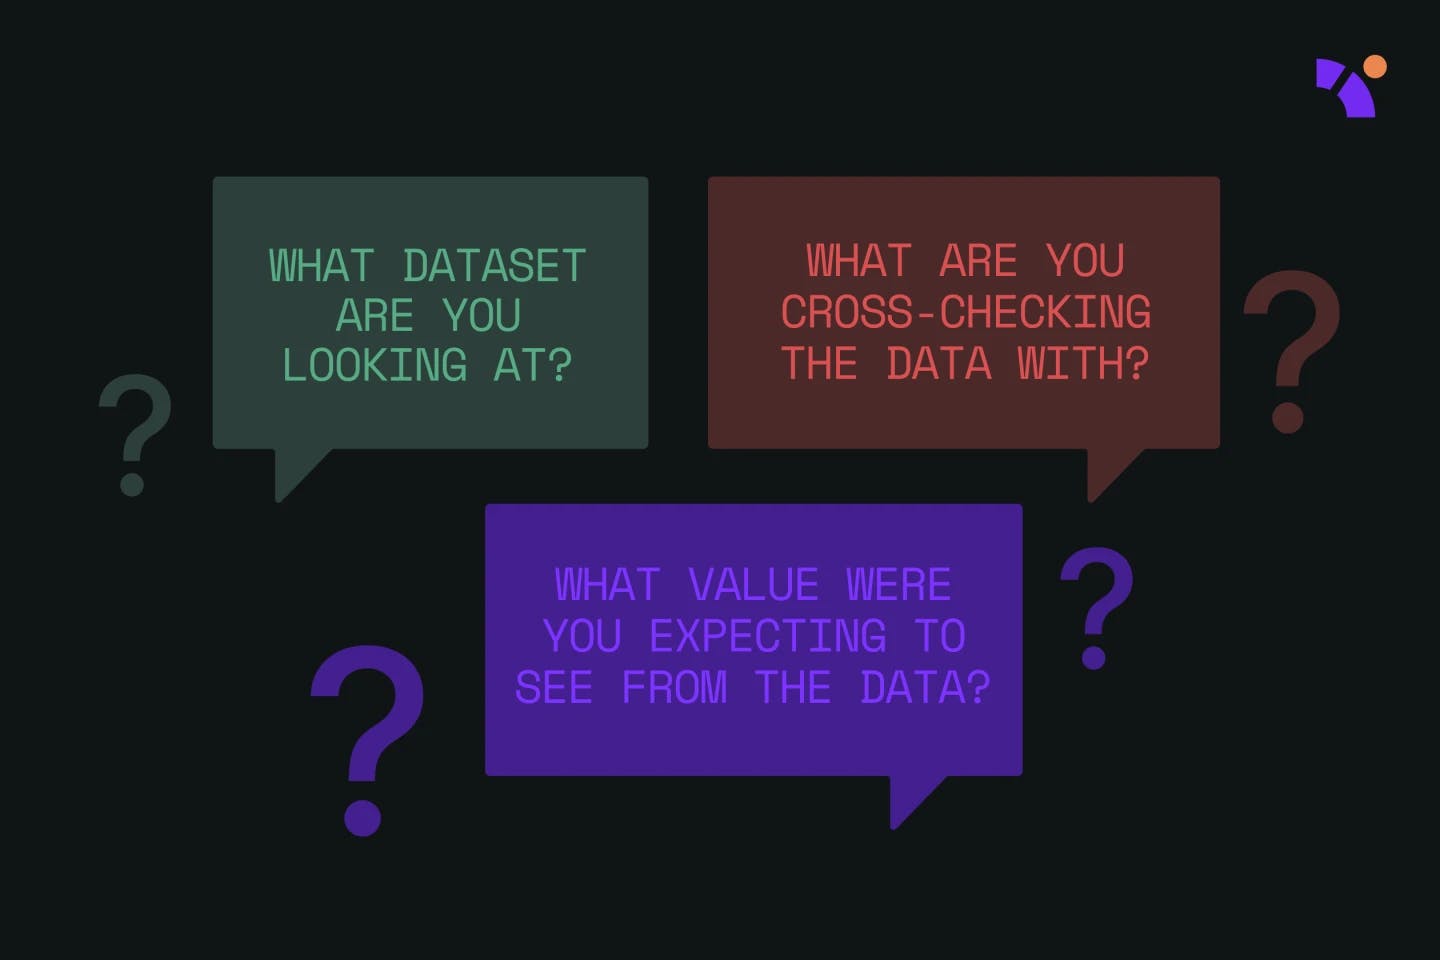
- What dataset are you looking at?
- How do you know the data is wrong?
- What value were you expecting to see from the data?
- How does this impact the business?
Let’s explore what each of these questions helps the data team accomplish.
What dataset are you looking at?
This first question might seem obvious, but it’s essential. How can you fix what you can’t even see? It’s imperative that business users are clear about where they are seeing a data issue. The less time you spend digging around for the discrepancy itself, the more time you can spend identifying the root cause and fixing the problem. Have the business user tell you which exact dataset they are looking at or even which dashboard/report they are viewing.
How do you know the data is wrong?
This is a question that often goes unasked. It’s easy to spring into action and start looking for ways to fix the problem, but first, you need to make sure there actually is a problem.
Ask the business user where they are looking to check that the numbers being produced by the data team are indeed wrong. Is there another tool they use and trust more than the product the data team provides?
For example, Google Analytics data might exist in two places. Marketing teams might look at the UI directly for their analytics from Google while the data team ingests the data directly into a data warehouse and references it in downstream marketing data models. A user could have noticed that the numbers on the UI and within the data model don’t match up.
In this case, it’s important for the user to specify that they look at the Google Analytics UI as the source of truth for Google Analytics data. This way, you can determine how good this is as a benchmark and identify the true single source of truth.
What value were you expecting to see from the data?
You need to understand not only where a business user is comparing numbers but also what they expected to see that they didn’t see. What is the data meant to show that it currently does not? Is there a metric that’s lower or higher than expected?
I recommend taking a “narrowing it down” approach:
- Filter on a specific dimension of your data, like a specific campaign.
- Filter the data for a very specific time, such as a certain month.
- Compare the two data sources on a daily level to see where values start to vary.
Pull the actual numbers if that’s possible to cross-check all the data. Encourage business users to download available CSV files or take screenshots of exact numbers in these external tools. Taking these steps in combination with the “narrowing it down” approach means that you are sure to get to the root cause quickly.
How does this impact the business?
Prioritization is HARD. Data teams get a lot of requests from business users, and it can be quite difficult to identify the important ones from those that aren’t so important. While every business user tends to think their request is life or death, it’s important to think about how it impacts the business as a whole.
Customer-facing issues are always a top priority. If it affects customers, chances are it needs to be completed right away. Having a system of questions like this in place for when a data issue arises will actually help weed out low-priority requests. These requests somehow have a way of working themselves out and disappearing off the data team’s radar. Systems create some friction, ensuring only the most important requests make it onto the data team’s agenda.
Systems are the key to solving collaboration problems
Implementing a collaborative system for dealing with data problems will create a positive experience for business users and the data team. A simple set of intake questions will allow you to reduce the time you spend communicating over the issue and solving it.
It’s also important to note that a lot of these issues arise from not having a proper single source of truth. If business users depend on external sources for reliable data rather than internal data products that you provide, you will run into data issues more frequently. A single source of truth will keep data standardized across multiple sources, making analysis and reports accurate. Establishing this will create trust in the data products built for business users.
Data platforms like Y42 help to create a single source of truth that business users can rely on. They centralize all your data so that it lives in one place. Compared to external products, business users know they can trust a platform like Y42. Platforms like this also allow for easier collaboration when issues arise because everything is located in one place.
Category
In this article
Share this article