
The influencer boom, which ensued with the rising popularity of social media, is starting to catch the attention of more and more companies. One thing has become obvious for most ecommerce businesses: influencer marketing is indispensable for a holistic online marketing strategy.
But why has influencer marketing become so prevalent? Generally speaking, this approach enables marketing teams to target newer and younger audiences, diversifying the reach their marketing efforts might have by including the digital-native, social-media-focused generation.
Let’s keep in mind that influencer marketing is the digital epitome of social proof: when a creator you like or relate to promotes a specific product or brand, you’re more likely to take their word for it and check out said product or brand. So influencer marketing isn't limited to boosting your brand's recognition; it can even trigger actual online sales. All thanks to good old “word-of-mouth” tactics.
Now, thinking about influencer marketing from an entrepreneurial perspective, it is crucial to quantify the monetary success of the campaigns you run. Especially if you deploy campaigns with the goal of boosting sales by X% (quantifiable metric) instead of simply increasing brand awareness (which is more qualitative and harder to measure).
With the following article, we intend to show you what to do after you have successfully leveraged the power of influencer marketing by running influencer campaigns. If you want to understand your campaign’s performance and outcomes, then this article is for you.
Keep reading if you want to learn how to build a single-channel discount code influencer marketing attribution model. By pulling Shopify order data and Google Sheets activity and cost data, we will analyze the resulting order revenue.
Getting your data sources in place
After integrating the necessary data sources for your model, you now have to choose the relevant tables and columns you will need to create your model.
As you can see below, this is our recommended table-and-columns combination for the specific influencer marketing model you want to create. Check out step 2 in our step-by-step instructions below to learn how to select the tables and columns you want to work with.
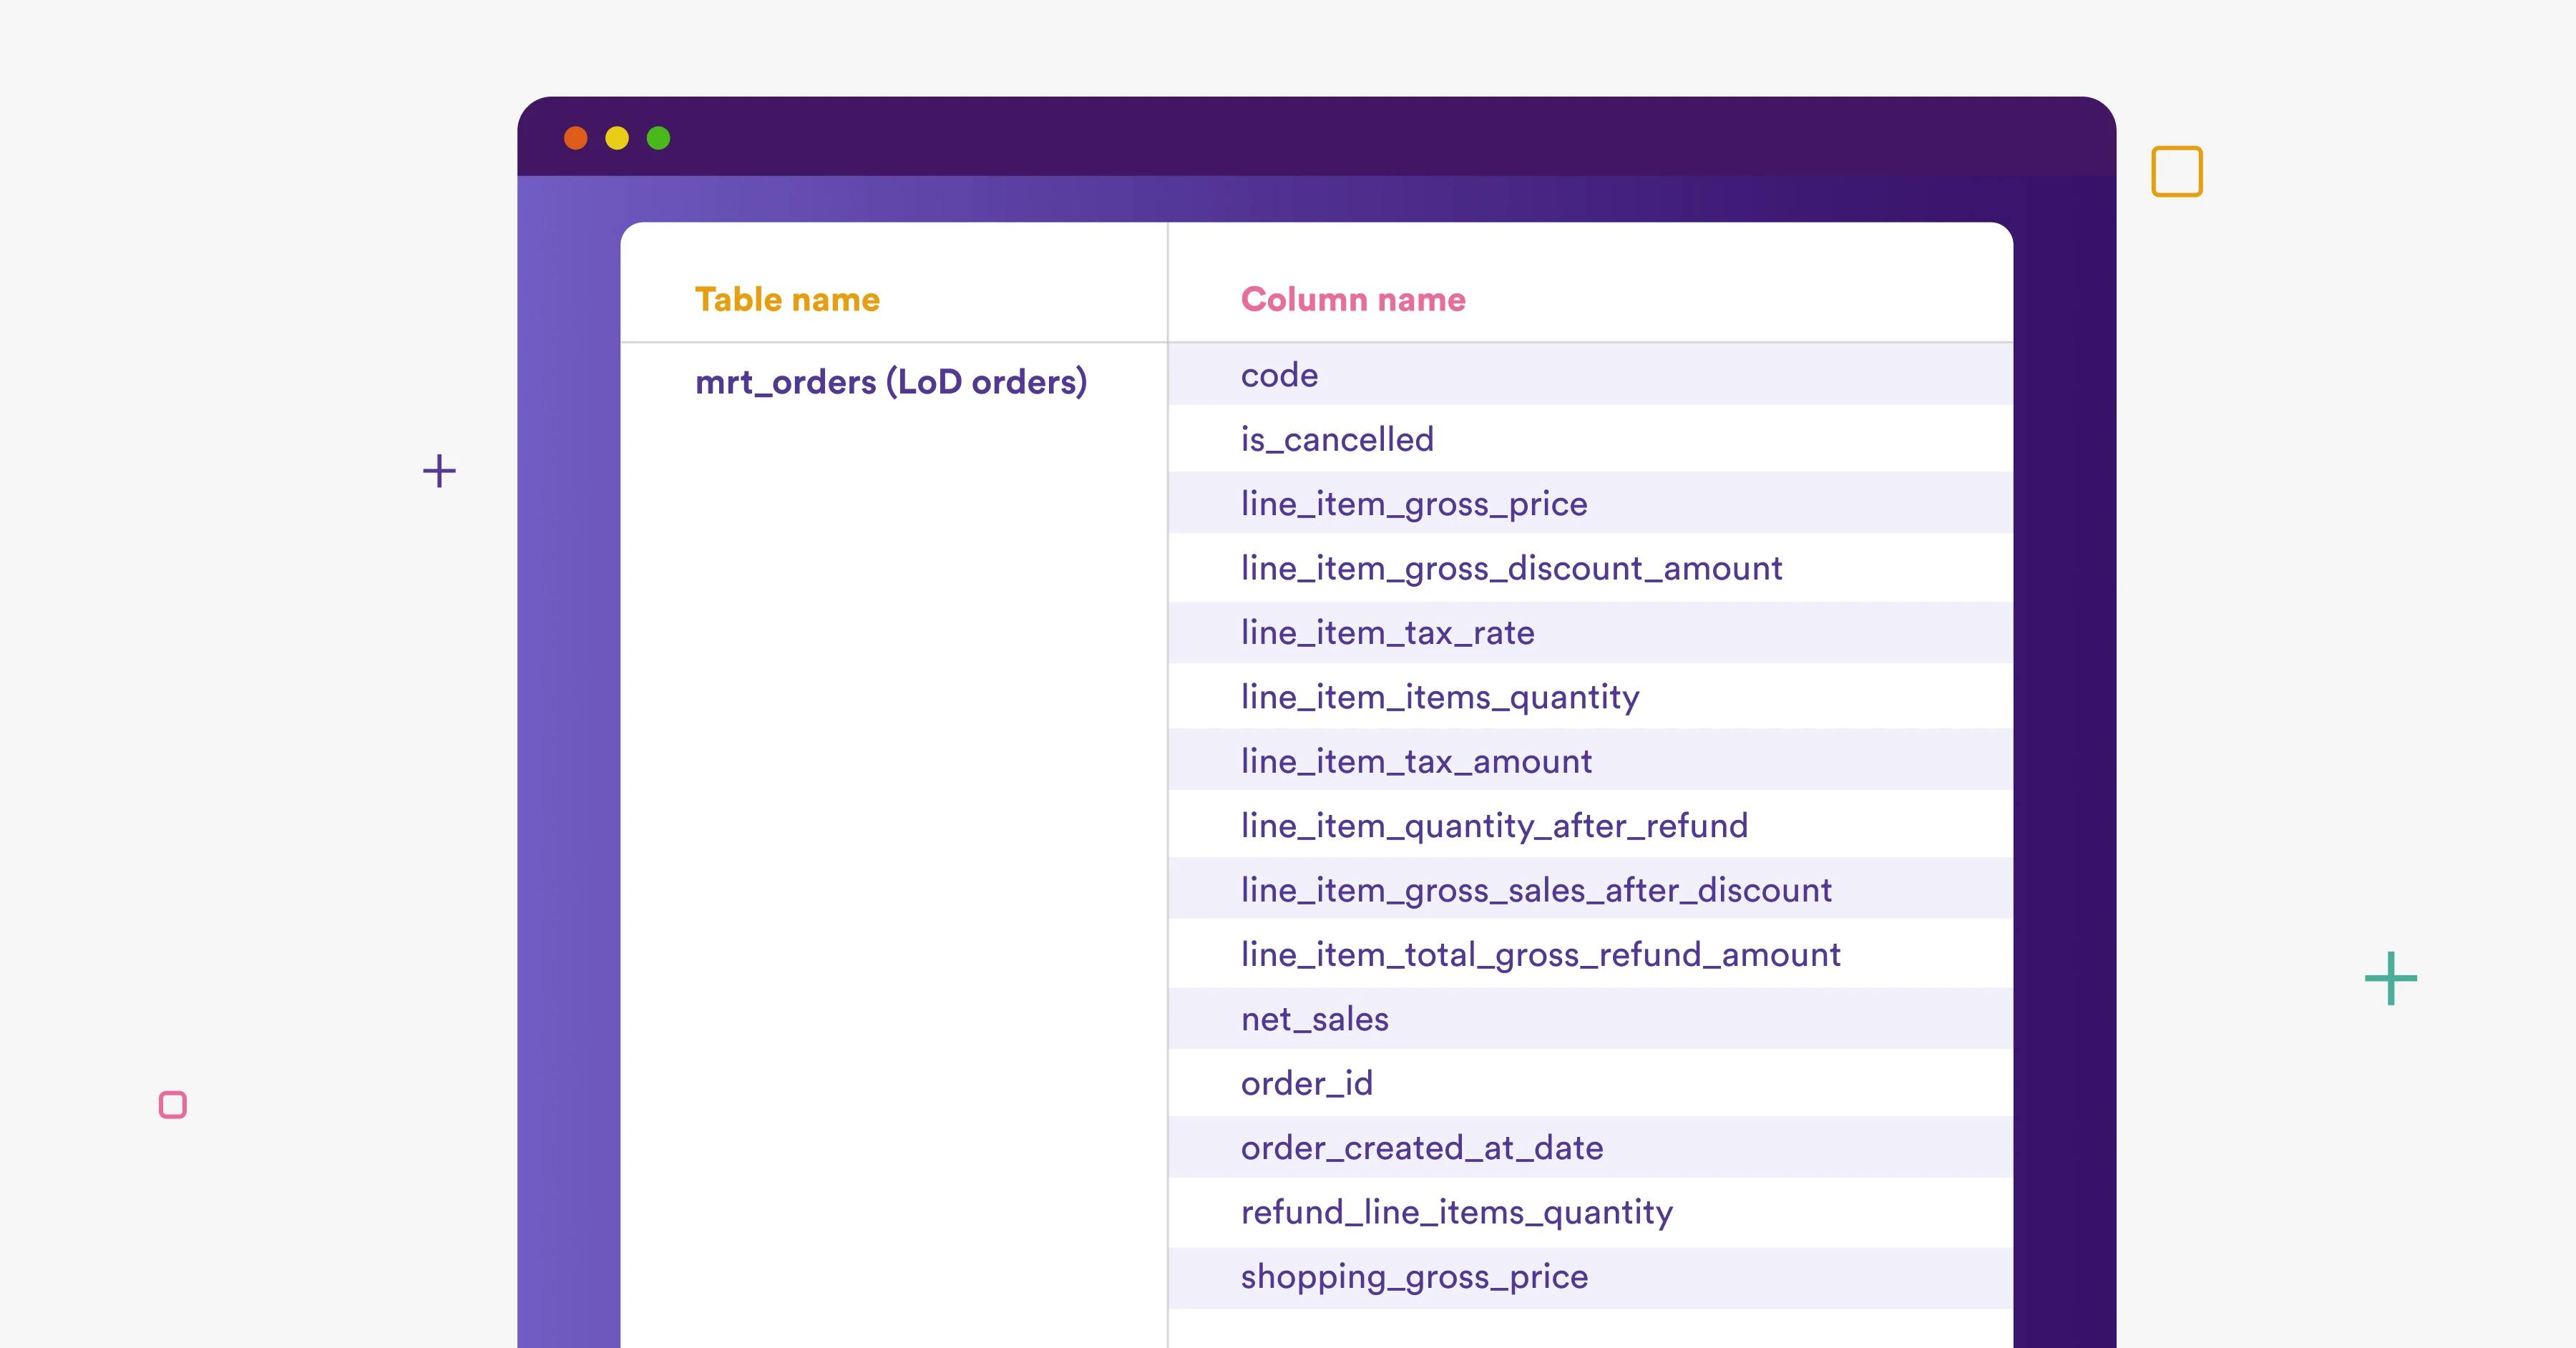
Input of transformed Shopify order table.
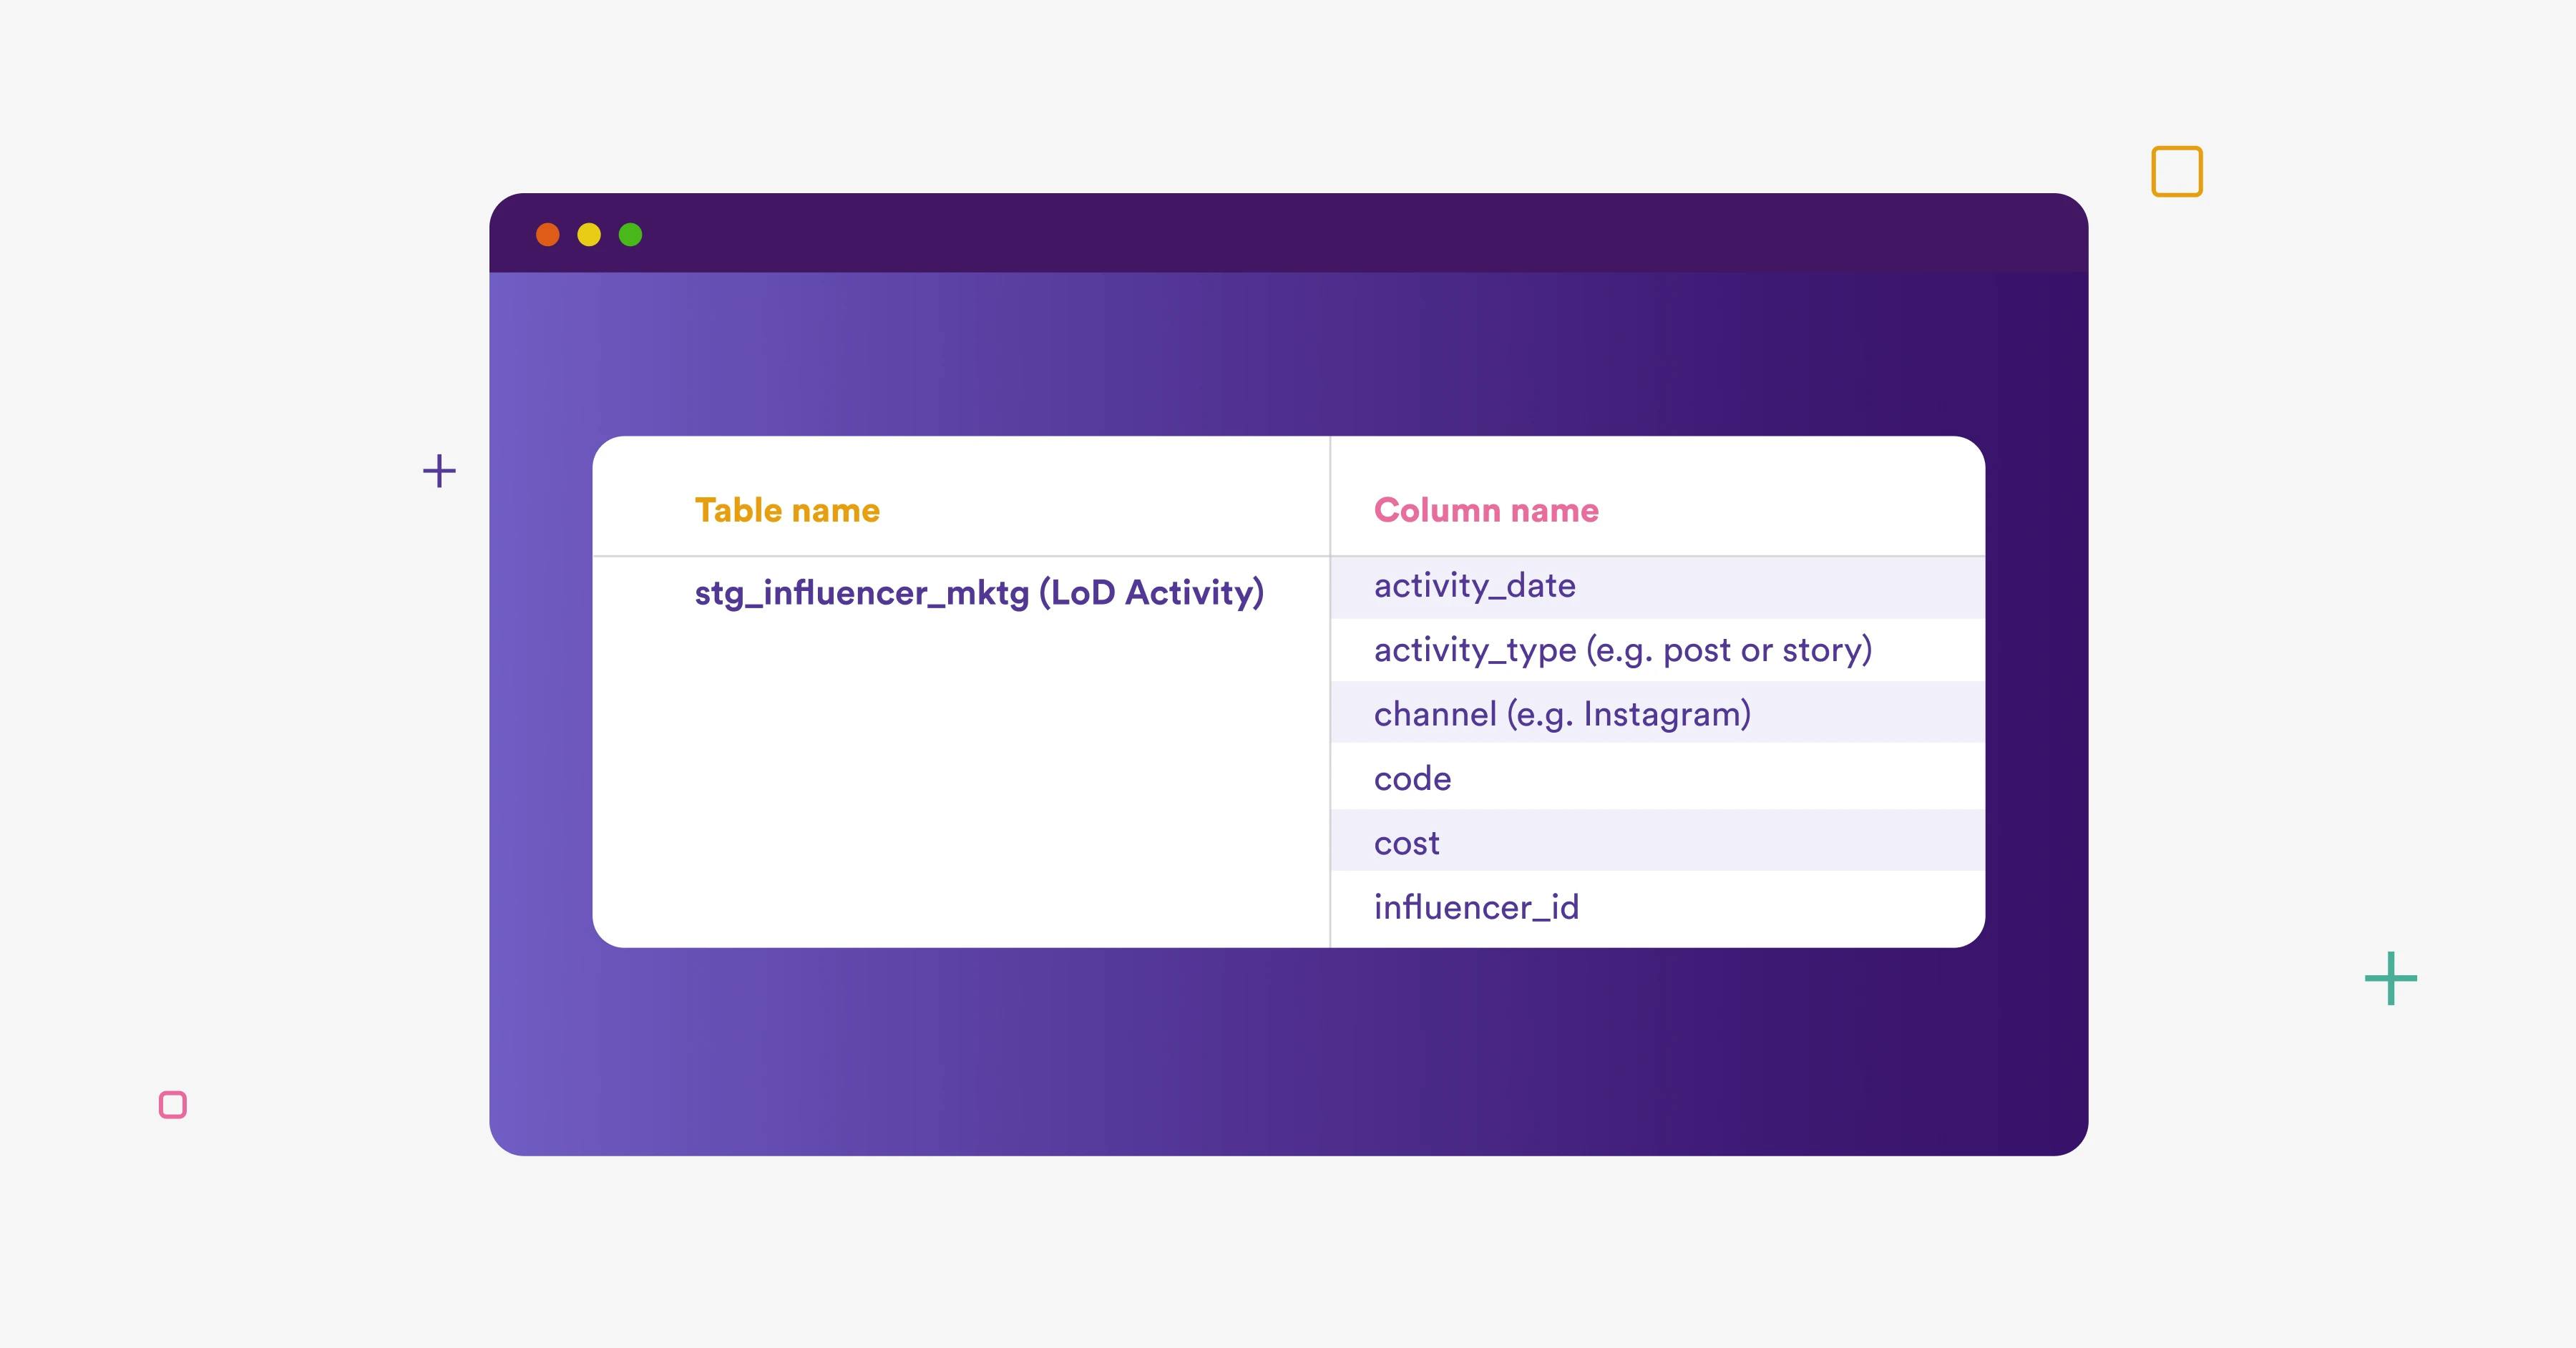
Input of Google Sheets influencer marketing table.
Creating your model step by step
Now that you have your sources in place and you’ve selected the tables and columns you need, you can move on to the fun part: actually building your model.
The following image depicts the developed model from beginning to end. Let’s understand each of the steps taken to build this single-channel discount code influencer marketing attribution model (from left to right):
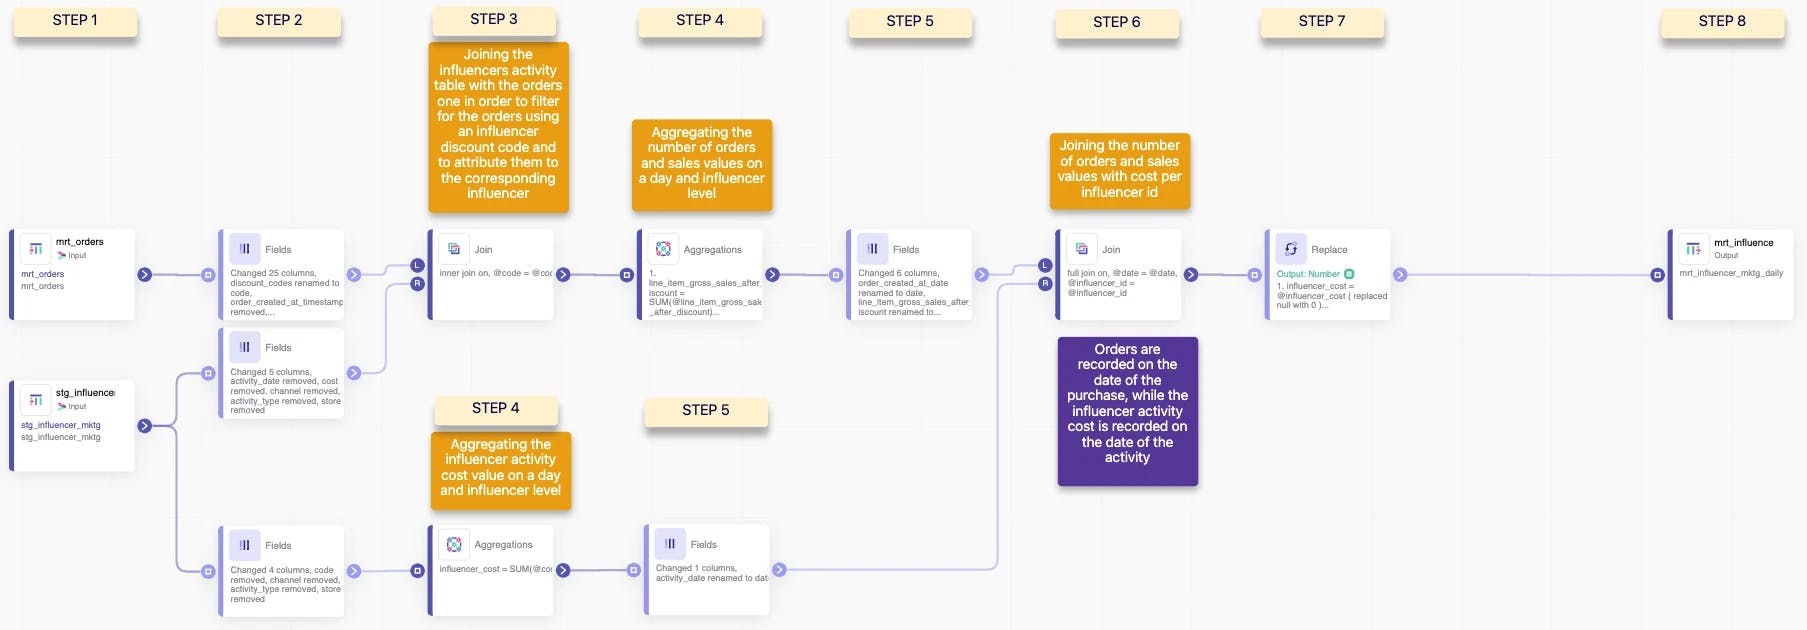
- Step 1: Load the two aforementioned input tables (the Shopify order table and Google Sheets table) into the model via the input node.
- Step 2: Using a fields node, select the relevant columns you want to proceed with for this model. To know which tables and columns are relevant, see the images above where we outlined exactly that.
- Step 3: To vertically append the influencer_id to the orders table, apply an inner join function on the ID (discount) code.
- Step 4: Aggregate the data in both instances on a per-day and influencer level. Equal to a pivot table in Excel or the group by function in SQL, the aggregation node in Y42 allows you to change the granularity of your data according to your preferences.
- Step 5: Rename your selected columns according to your best-practice naming conventions by using another fields node.
- Step 6: Commit a full join between the appended order table and the influencer table on influencer_id and (...)date. This data manipulation combines sales with cost values, segmented by date and influencer.
- Step 7: Replace null values in the influencer_cost column with zeros.
- Step 8: Finalize the model via the output node and name it as mrt_influence_mkt_daily (see "modeling layer naming conventions" in our Data Modeling Guide, pp. 6–11).
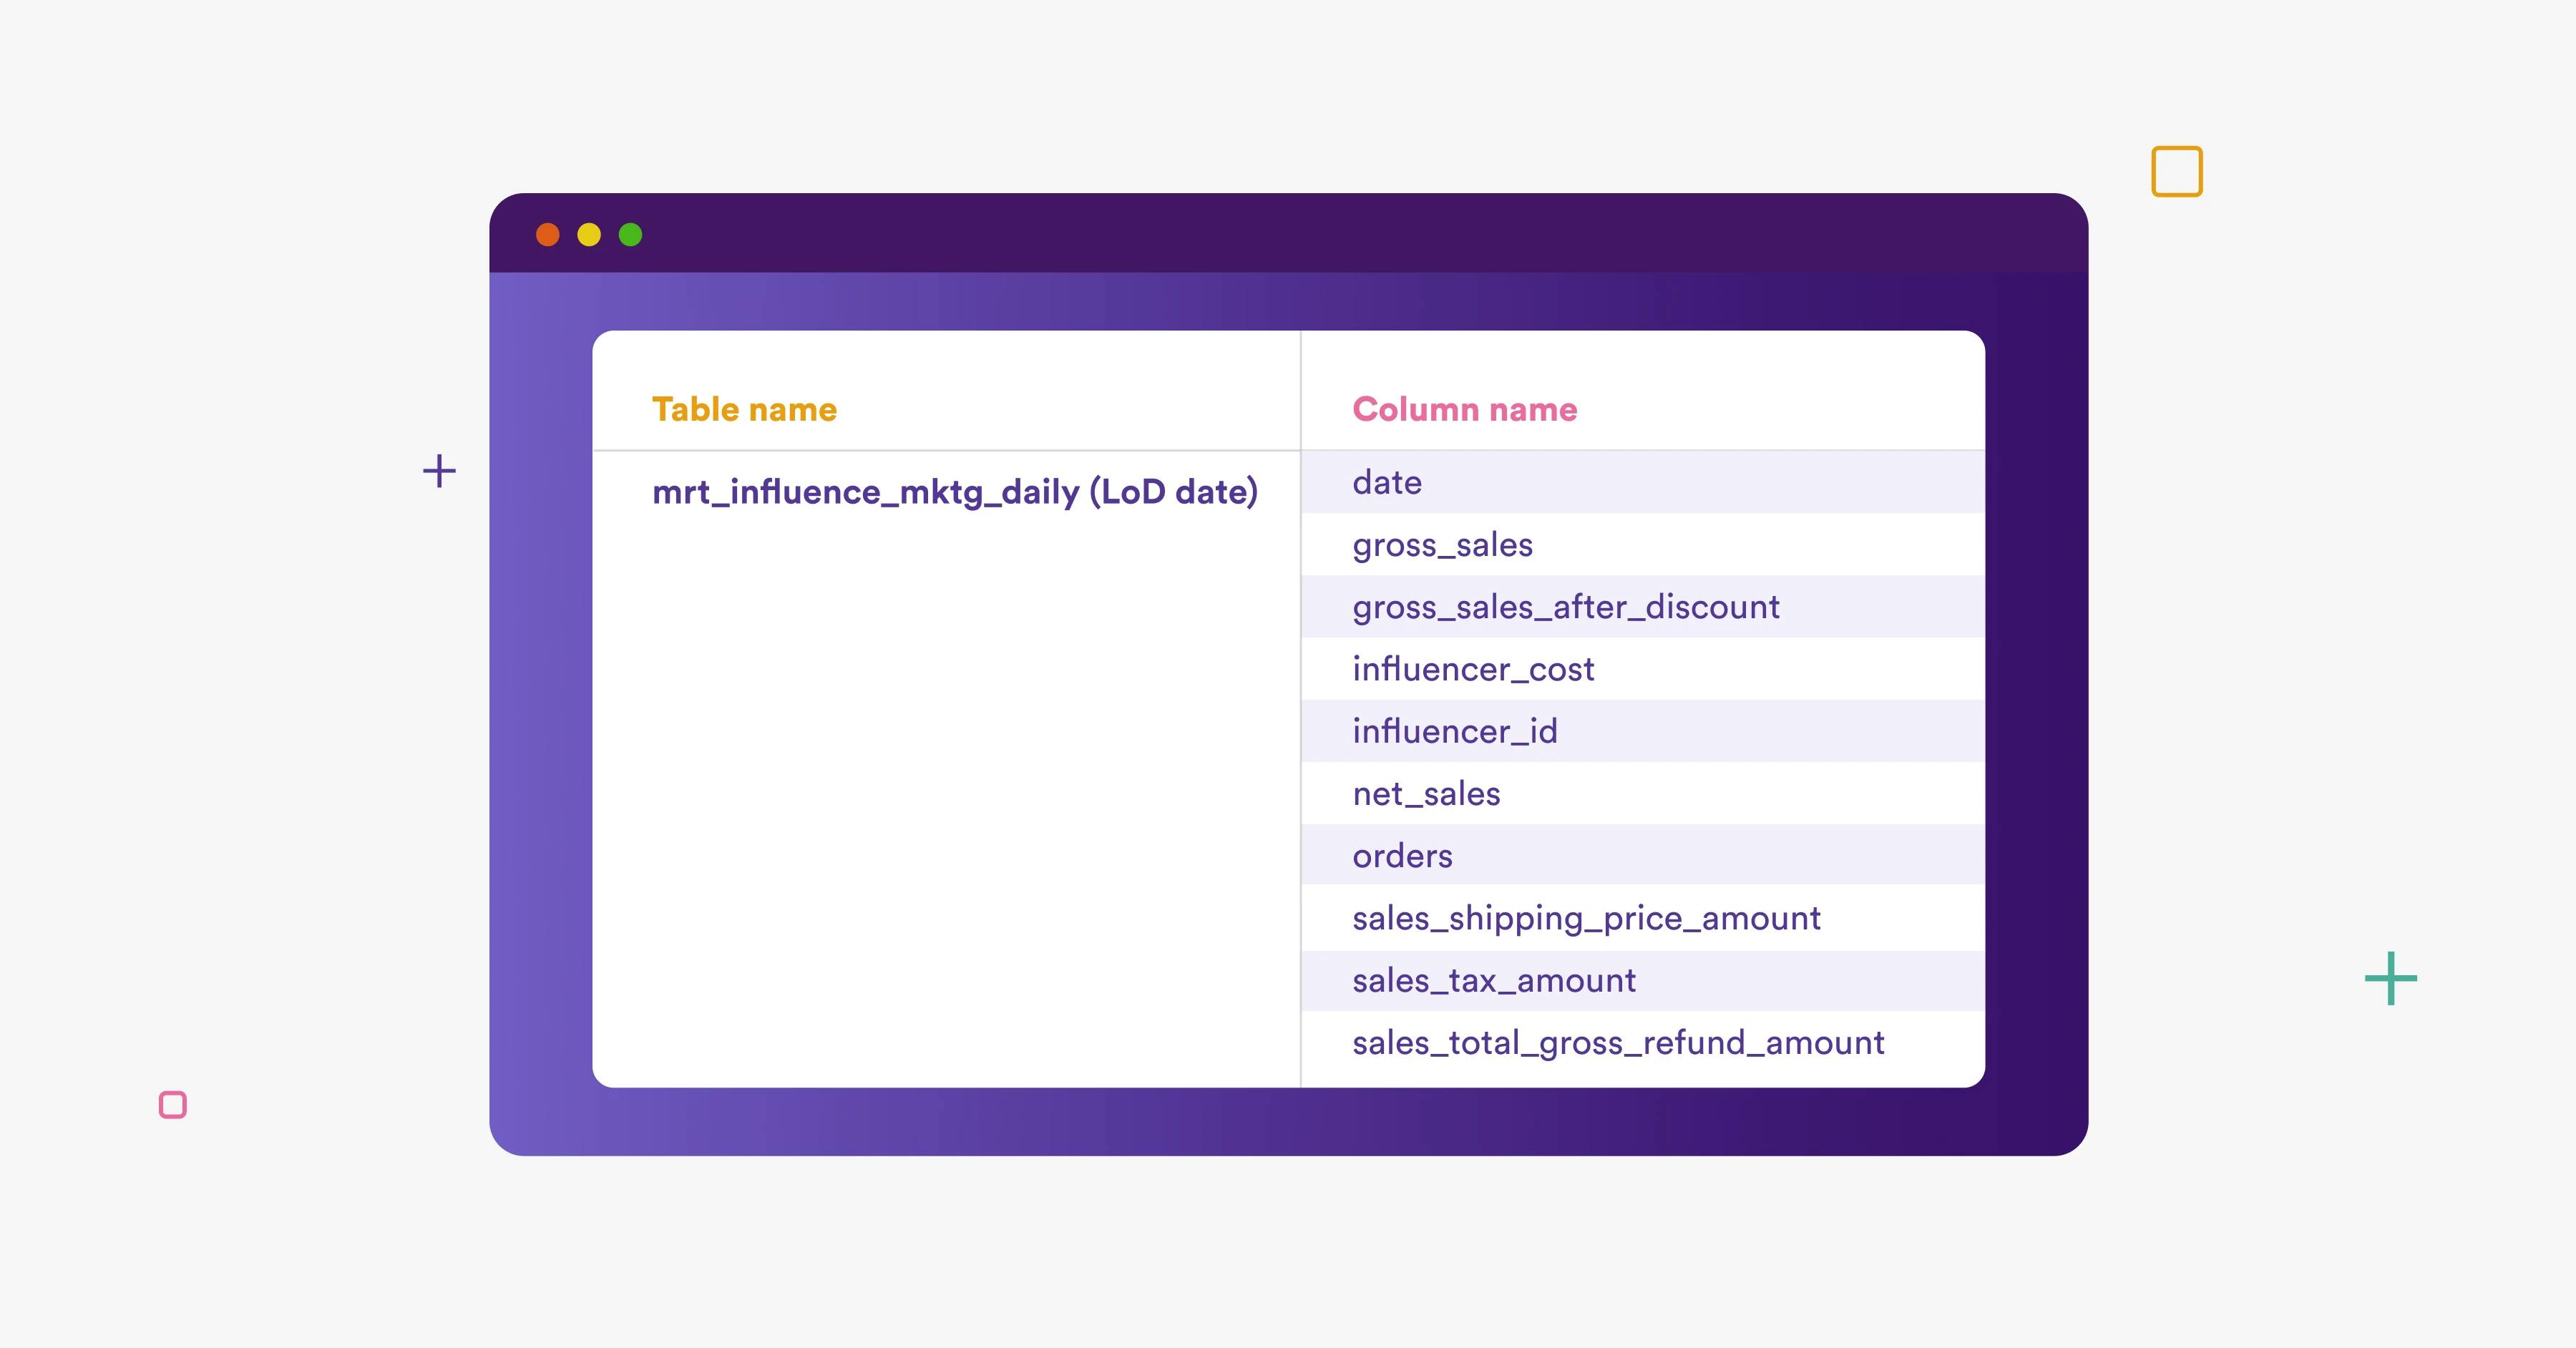
After performing the necessary data transformations, your output table should look something like this:
Visualizing your influencer marketing attribution model
Your output table is now ready to be consumed, so all that’s left to do is create the corresponding visualization on top of it. Because we are interested in gaining insights on the financial performance of your influencer marketing campaigns, the logical next step is to compare the costs with the (order) revenue attributed to them.
There are multiple ways to visually represent this comparison, and Y42 offers many different visualization options for doing so. For the sake of simplicity and understanding, we will focus on the following metrics and charts:
1. Overall influencer marketing financial performance
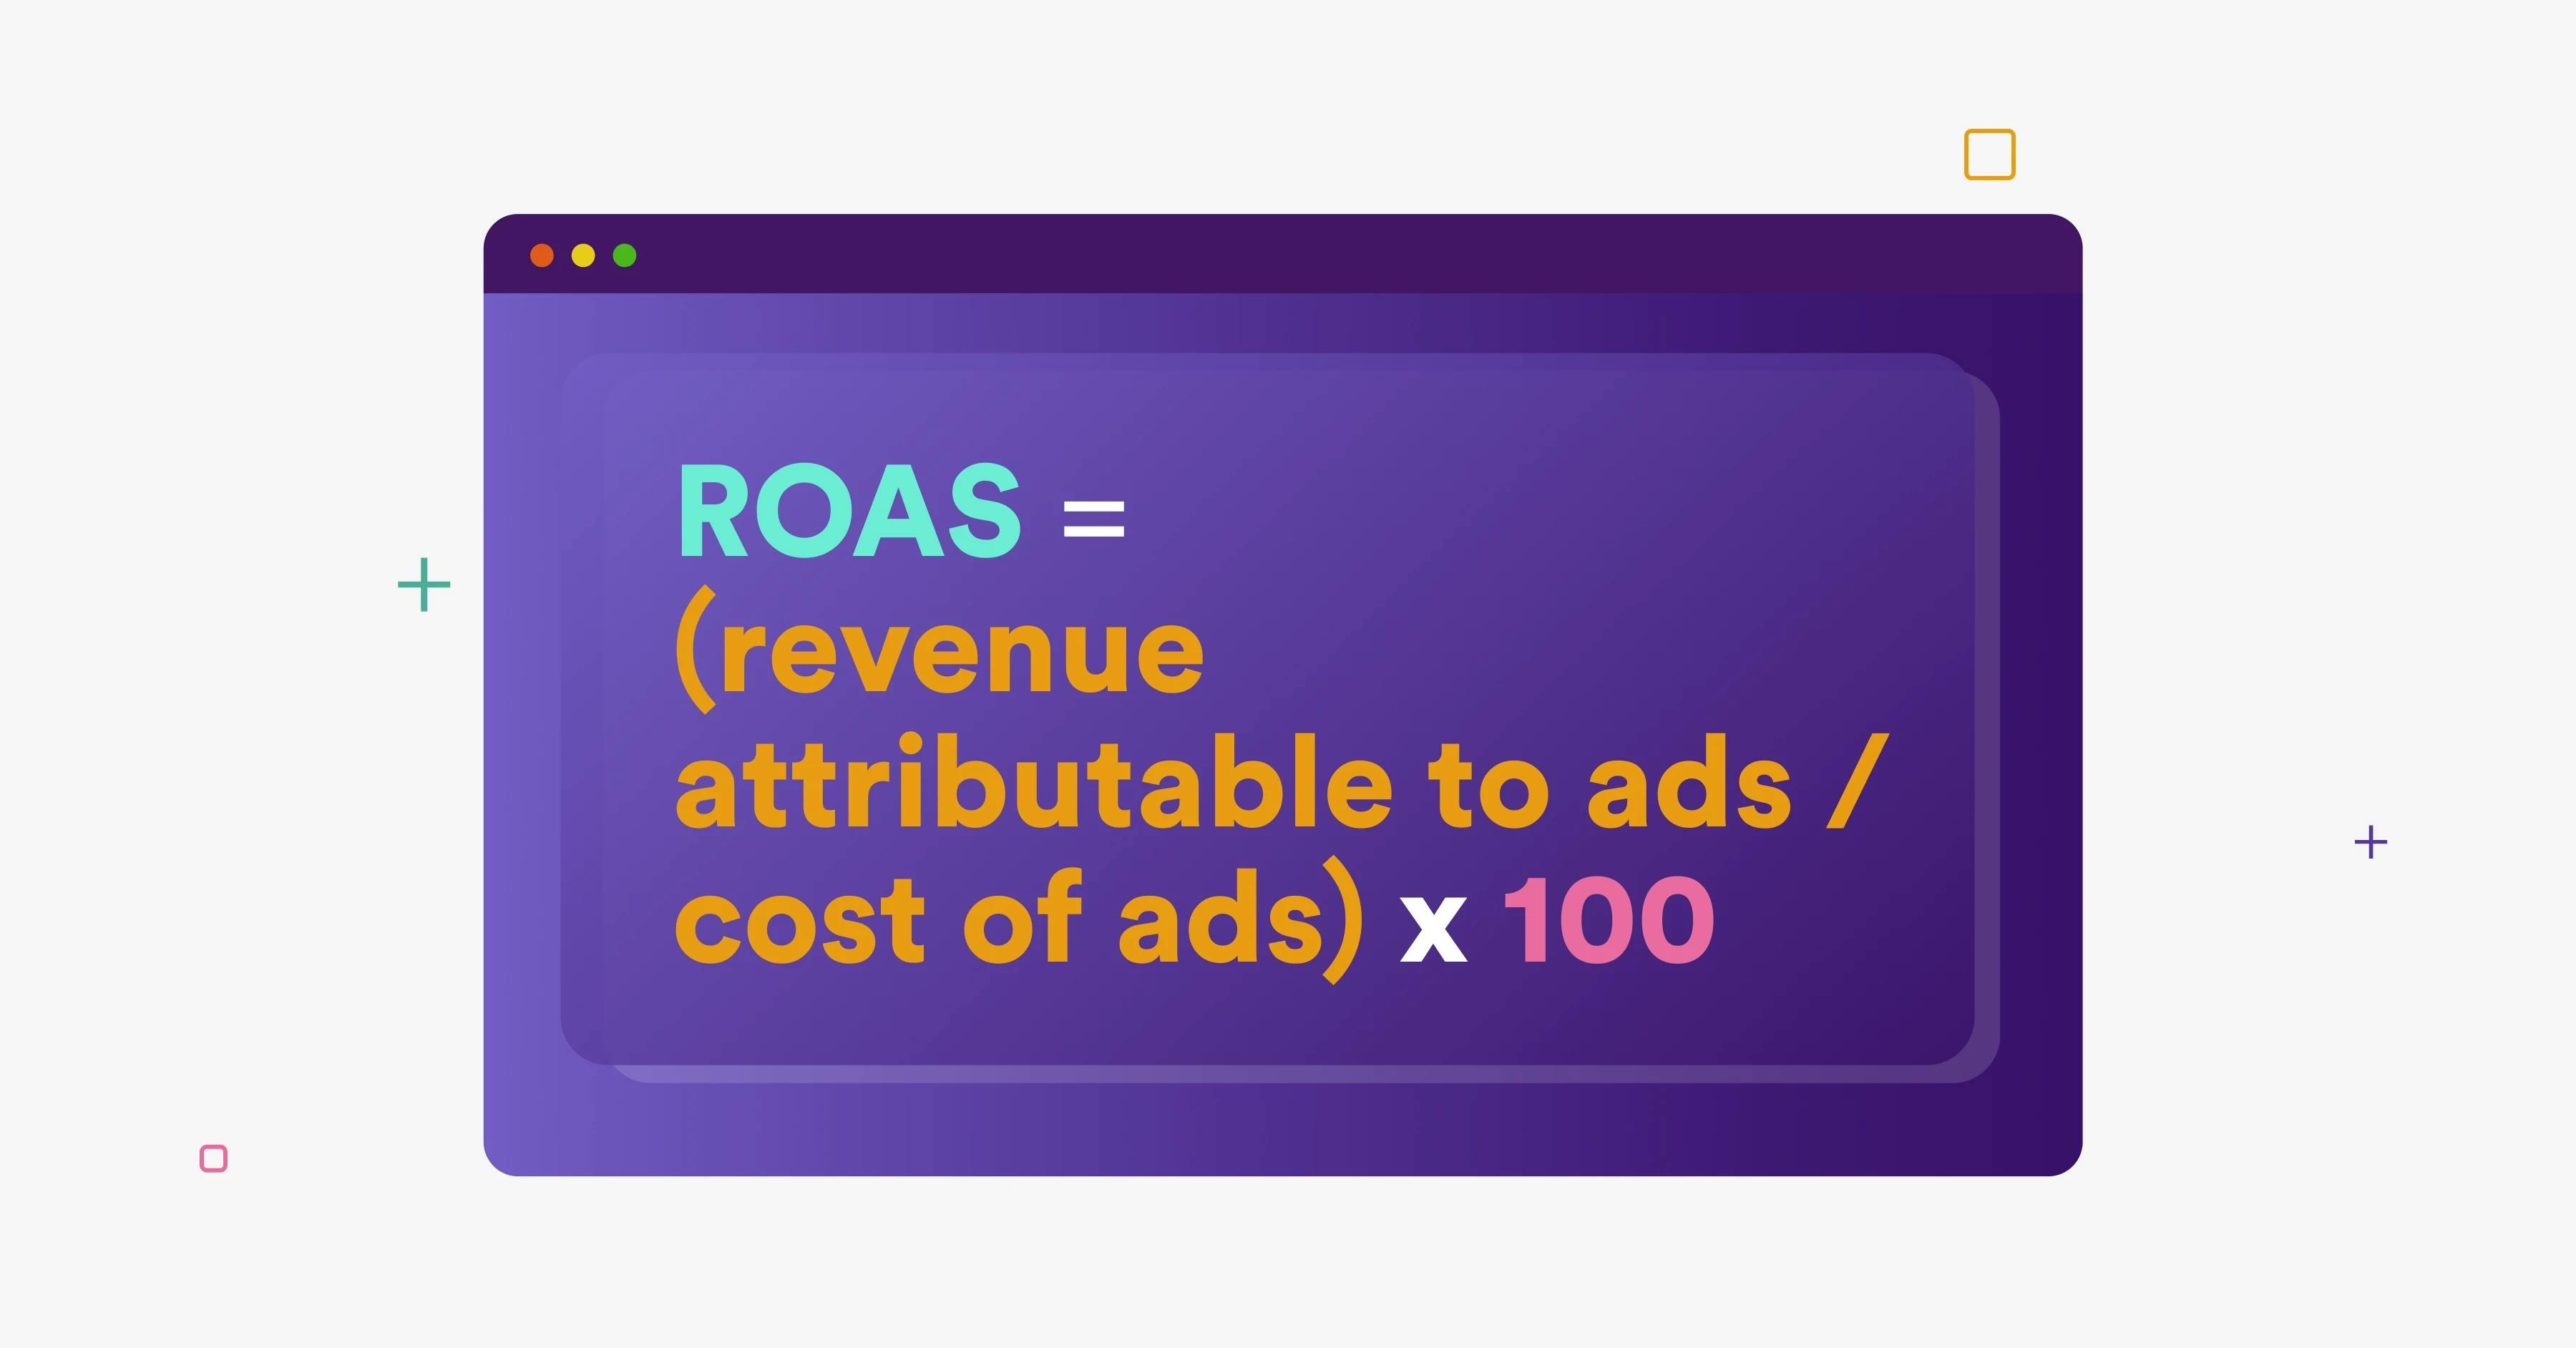
To determine whether your online influencer ad activity is financially rewarding, the KPI ROAS (return on ad spend) can be utilized. This KPI refers to the amount of revenue that is earned for every Euro spent on corresponding ads. It is calculated as follows:
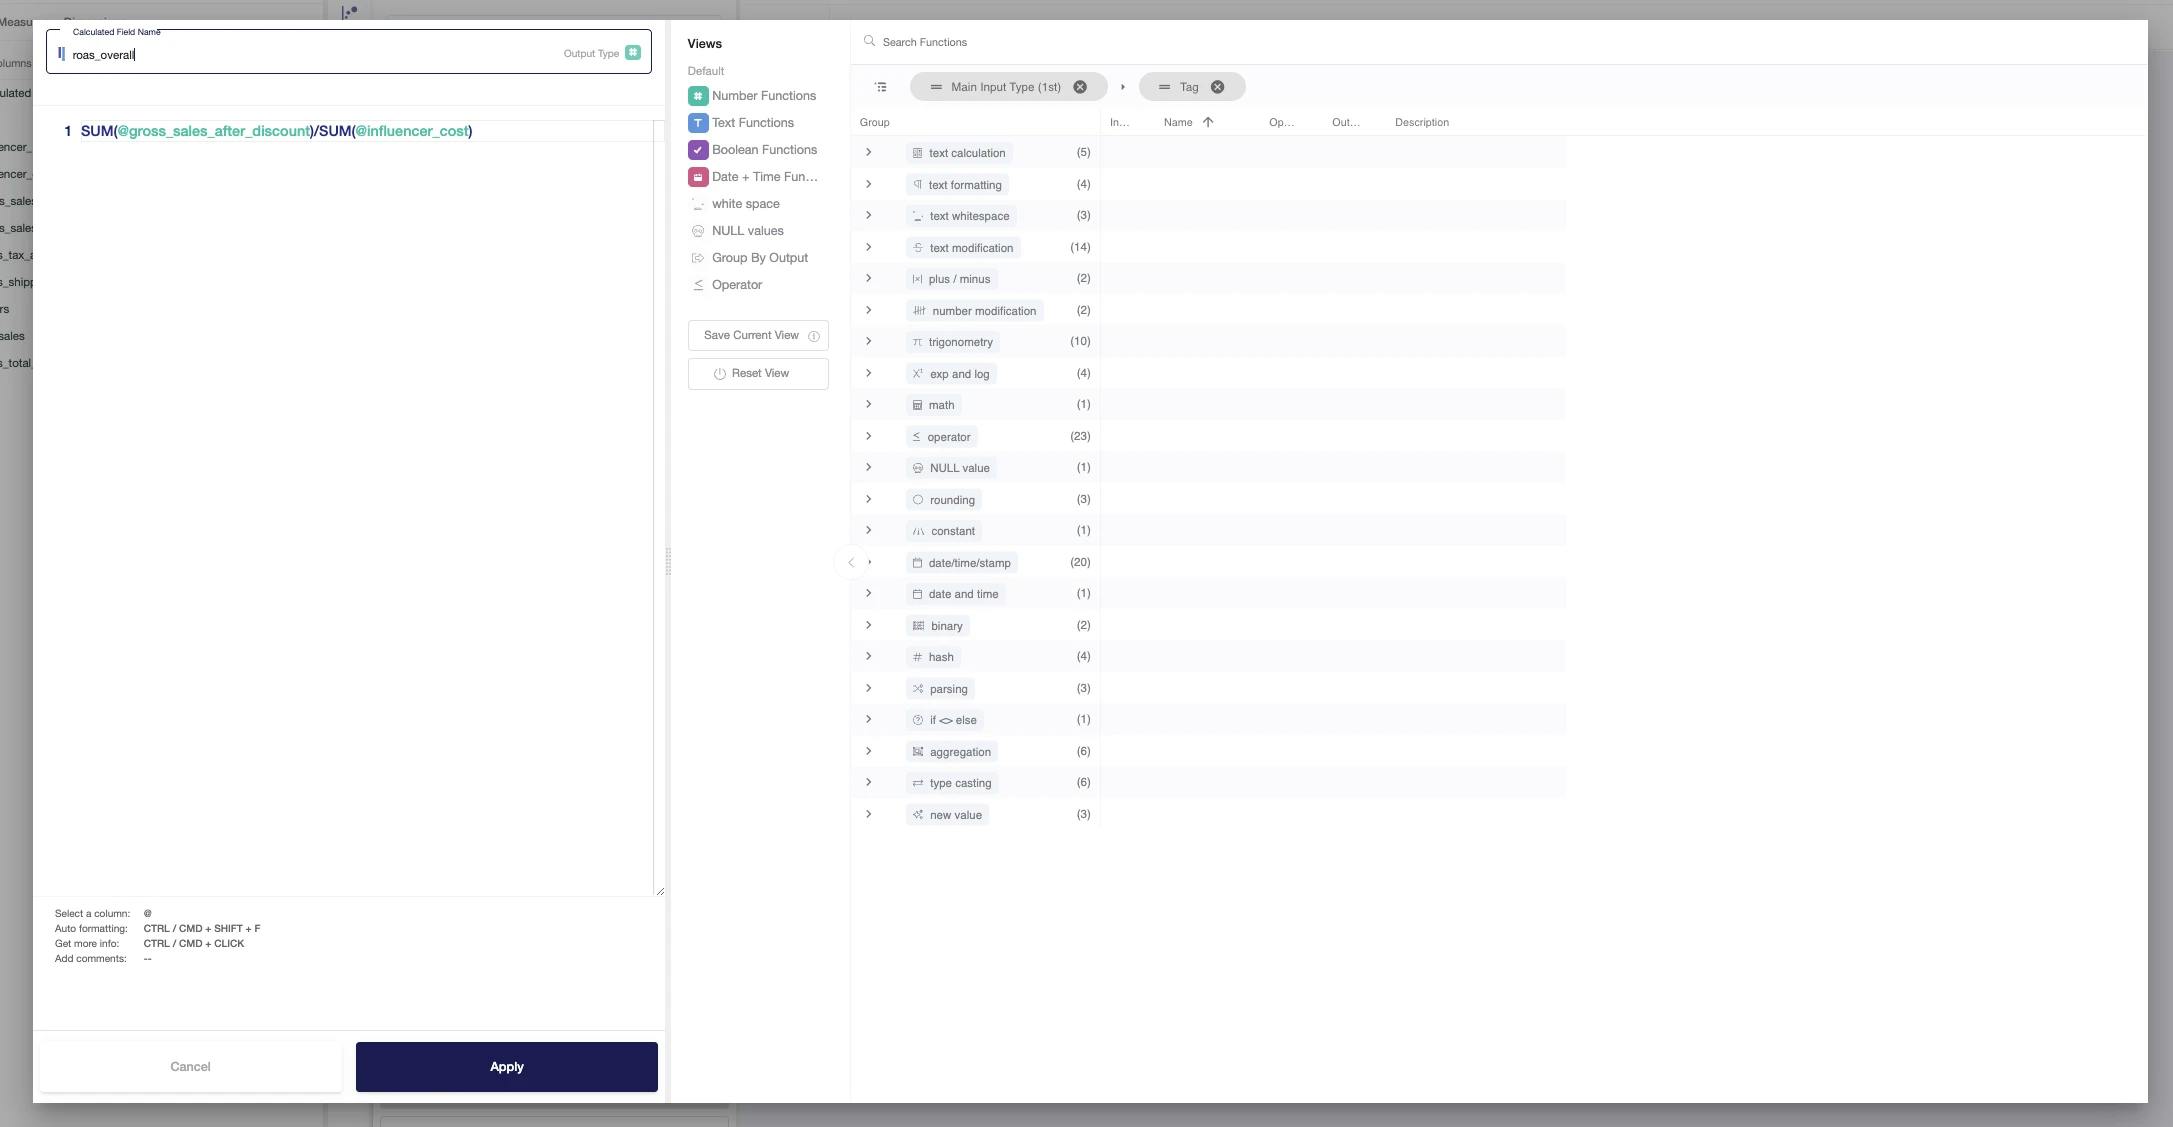
Building a number box
Looking at the columns in our output table, we can take influencer_cost as our cost item and opt for gross_sales_after_discount as the corresponding revenue item. All that’s left is to calculate the ROAS via a calculated field in the Y42 visualization layer (first image below) and then visualize the result in a number box (second image below).
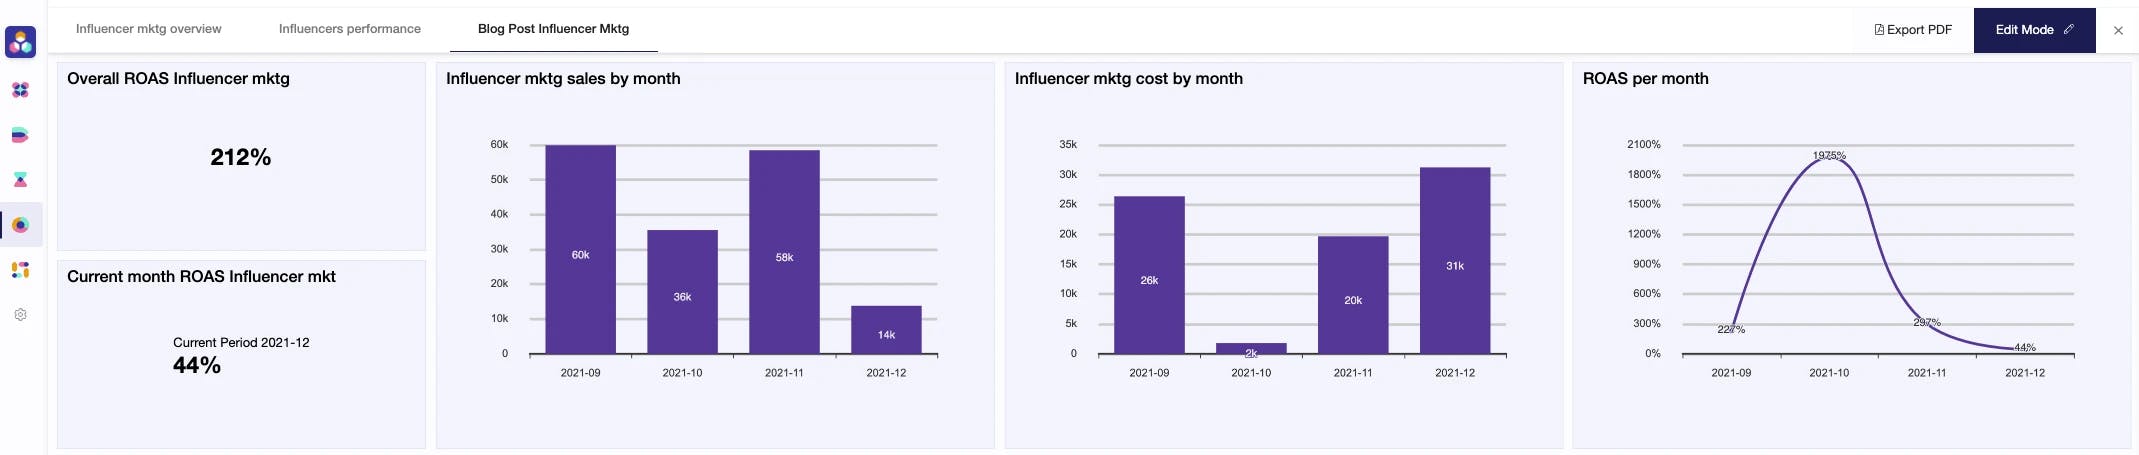
With a few extra clicks, we have created additional visualizations showcasing the overall ROAS result (top-left corner of the dashboard). The additional number box, bar charts, and line graph feature monthly overviews of the overall ROAS, adding more granularity to the analysis.
2. Financial performance per influencer
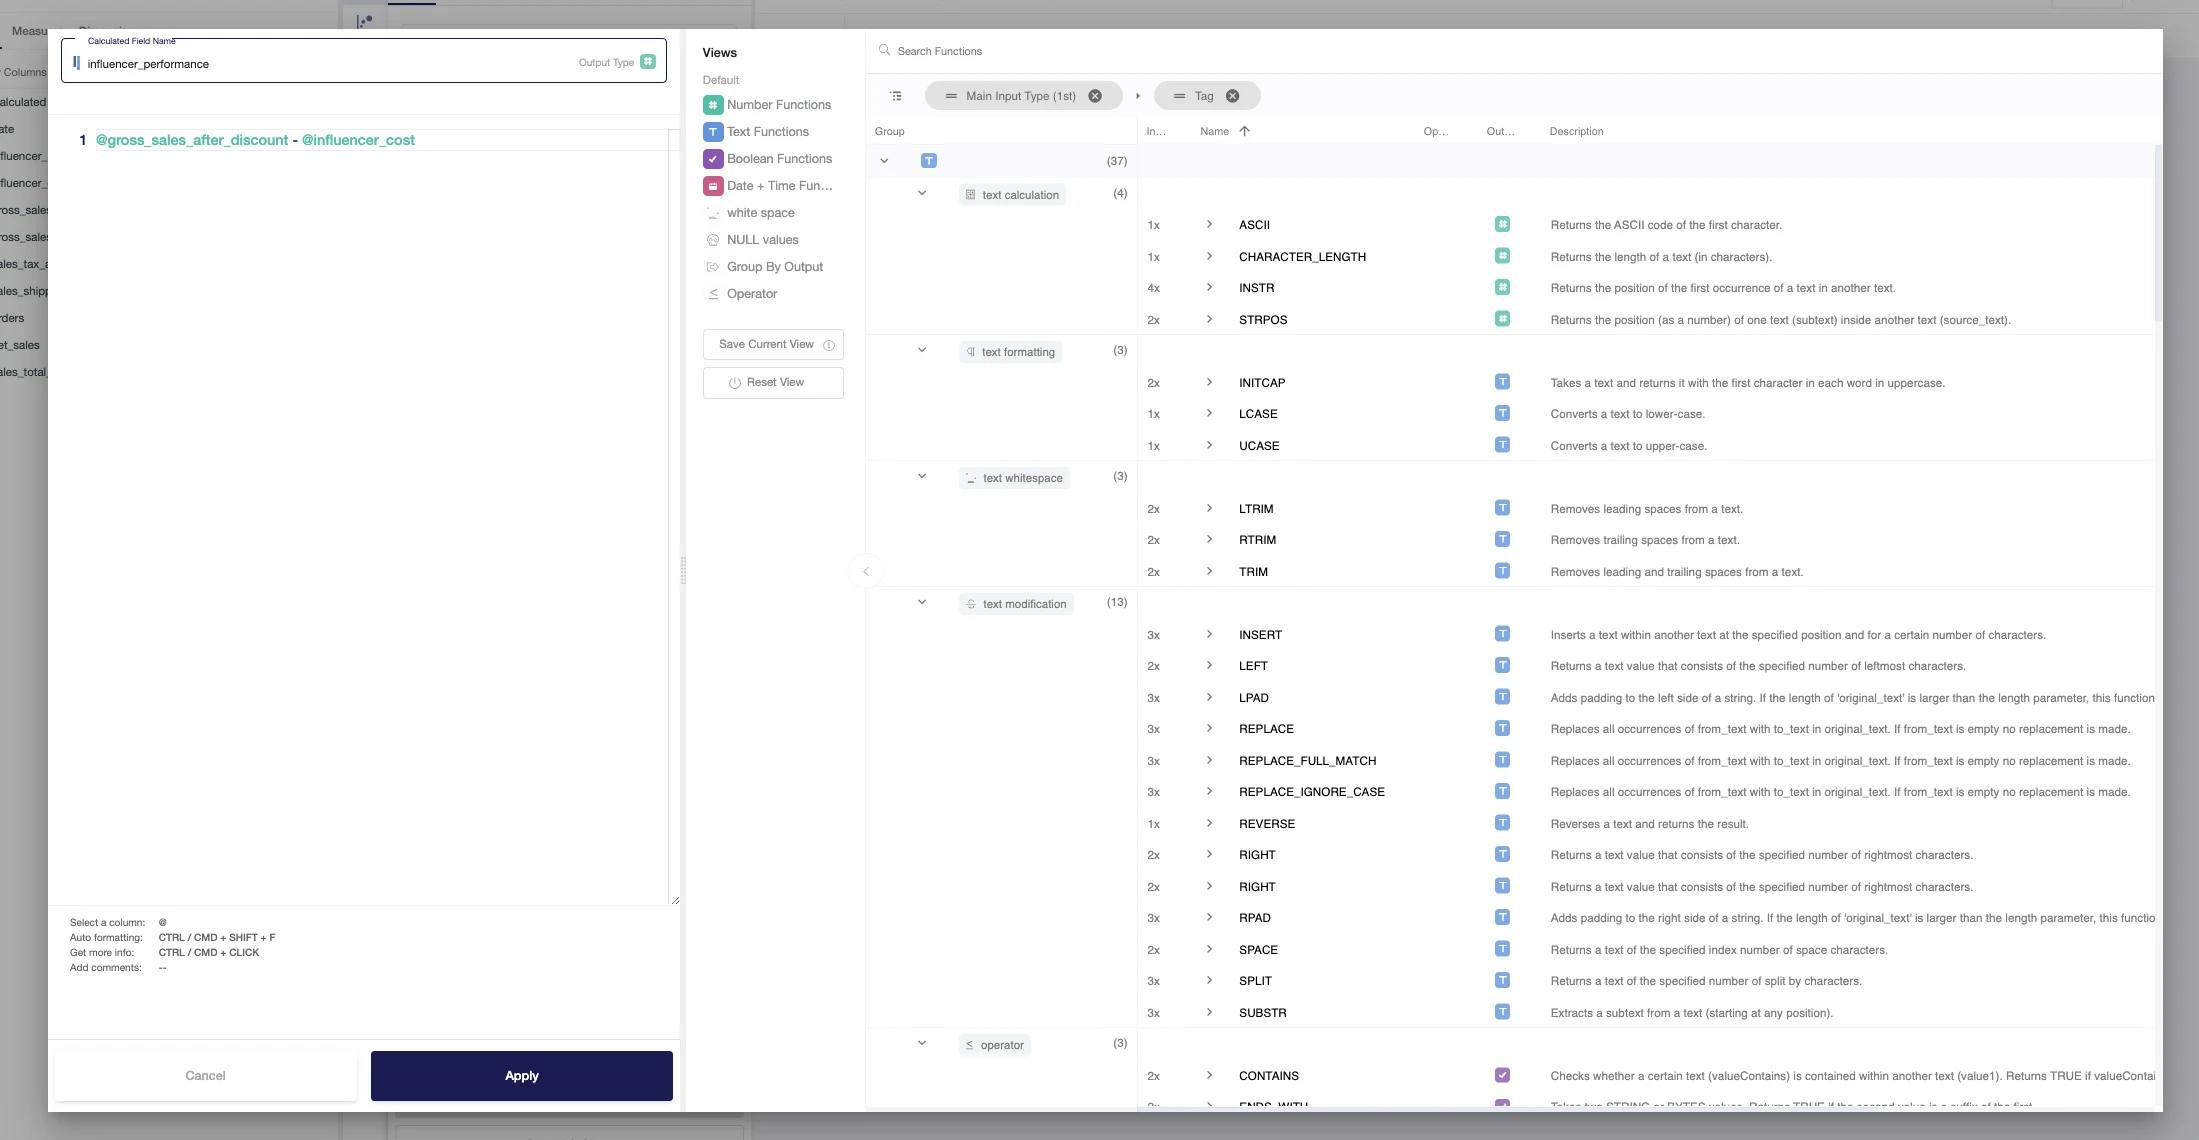
After quantifying the overall monetary success of your influencer marketing campaign(s), you can conclude your performance understanding with a key driver analysis. This allows you to isolate the relative contribution per influencer to the overall ROAS calculated in the previous point.
It simply requires another calculated field (first image below) and is then visualized with a bar chart, sorted in descending order from left to right (second image below).
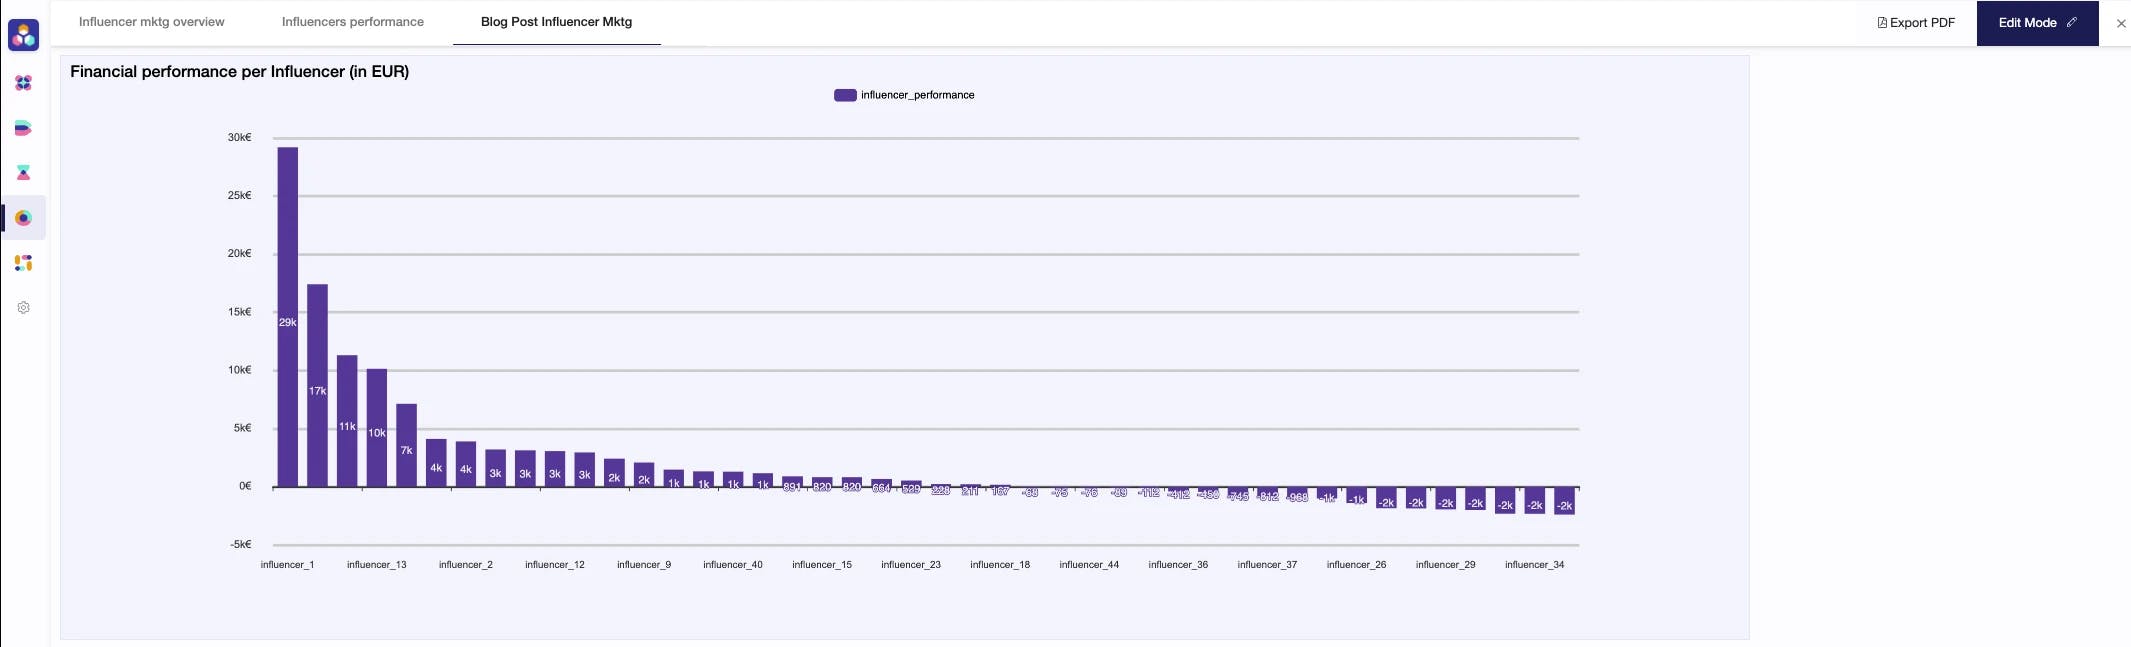
Having built our single-channel discount code influencer marketing attribution model and visualized the results, it’s clear that the top five high-performing influencers generated more than 85% of the total financial influencer marketing success in the test set.
Look ahead, stay ahead with the right influencer marketing attribution model
Based on the results from our model, we could move on to investigate whether the top-performing influencers have common traits and practices, talk about similar topics, have similar audiences, etc. This understanding could (partially) explain their dominant position and improve influencer selection for future campaigns going forward.
Furthermore, the present analysis could be extended, either by adding more data sources or changing the influencer participation model to a first, last-click, or multi-touch attribution model.
The possibilities are endless when it comes to understanding the performance of your influencer marketing efforts.
It’s time to get your influencer marketing analytics in check with Y42!
Category
In this article
Share this article