
Data professionals are constantly on the lookout for ways to improve their SQL skills in order to work more efficiently with vast amounts of data. This article aims to help you do just that by focusing on five advanced SQL functions that will elevate your data transformation skills. By mastering these functions, you will be able to manipulate and analyze data more proficiently, ultimately leading to better and quicker insights and decision-making.
This article will delve into SQL functions specifically tailored for streamlining data modeling and creating complex queries. These functions are:
- NTILE
- PARTITION BY
- PIVOT and UNPIVOT
- Wildcard functions
- LEAD and LAG
NTILE
NTILE is a window function in SQL that allows you to distribute rows into a specified number of “buckets” or “tiles” based on the values of a particular column. This function is especially useful when you need to segment data into percentiles, quartiles, or other groupings for reporting purposes or further analysis.
NTILE takes a single argument: the number of buckets you want to distribute the rows into. The function assigns each row to a bucket based on the specified column’s values and in accordance with the desired number of buckets. Rows with equal values may be assigned to different buckets, depending on the distribution of the data.
Here’s an example of how you can use NTILE to divide employees into four quartiles based on their salaries:
SELECT
 employee_id,
 salary,
 NTILE(4) OVER (ORDER BY salary) AS quartile
FROM
 employees;
In this example, NTILE is used to assign employees to one of four quartiles based on their salaries. The result set will show the employee_id, salary, and corresponding quartile for each employee.
Mastering the NTILE function will enrich your SQL skills by providing a practical and efficient way to segment data into groups for further analysis. This function enables you to carry out various analytical tasks, such as categorizing items into price tiers, analyzing performance metrics in percentiles, or determining data distributions.
PARTITION BY
PARTITION BY is a powerful clause that enables you to divide a result set into partitions or subsets to which window functions can be applied. This clause is used in conjunction with window functions like SUM, AVG, ROW_NUMBER, RANK, NTILE, and others to perform calculations and comparisons within specific groups or categories of data rather than the entire result set.
The PARTITION BY clause is used within the window function’s OVER clause, allowing you to specify one or more columns by which the data should be partitioned. When using PARTITION BY, the window function will restart its calculations for each partition, providing you with more granular and context-specific results.
For instance, you can use PARTITION BY with the ROW_NUMBER function to assign a unique row number within each department of a company:
SELECT
 employee_id,
 department,
 salary,
 ROW_NUMBER() OVER (PARTITION BY department ORDER BY salary DESC) AS rank_within_department
FROM
 employees;
In this example, the ROW_NUMBER function is used to assign a unique rank for each employee based on their salary, but the ranking is calculated separately for each department. By using the PARTITION BY clause with the department column, the window function restarts its calculations for each department, ensuring that the ranking is specific to each department’s context.
The PARTITION BY clause enables you to carry out more complex analytical tasks, such as comparing performance metrics within different groups, calculating growth rates for individual categories, or analyzing trends within specific segments. When you understand how to use PARTITION BY effectively, you will be able to manipulate your data on a deeper level and unlock enhanced insights.
PIVOT and UNPIVOT
PIVOT and UNPIVOT functions are extremely useful for reshaping and reorganizing data in order to meet various requirements. These functions can significantly improve the readability and presentation of your data by allowing you to restructure your result sets based on specific criteria.
PIVOT is used to transform rows into columns, effectively rotating your data into a more compact and organized format. It is particularly useful when you need to aggregate data and display it in a cross-tabular format, such as when generating summary reports or converting time series data into a more structured layout.
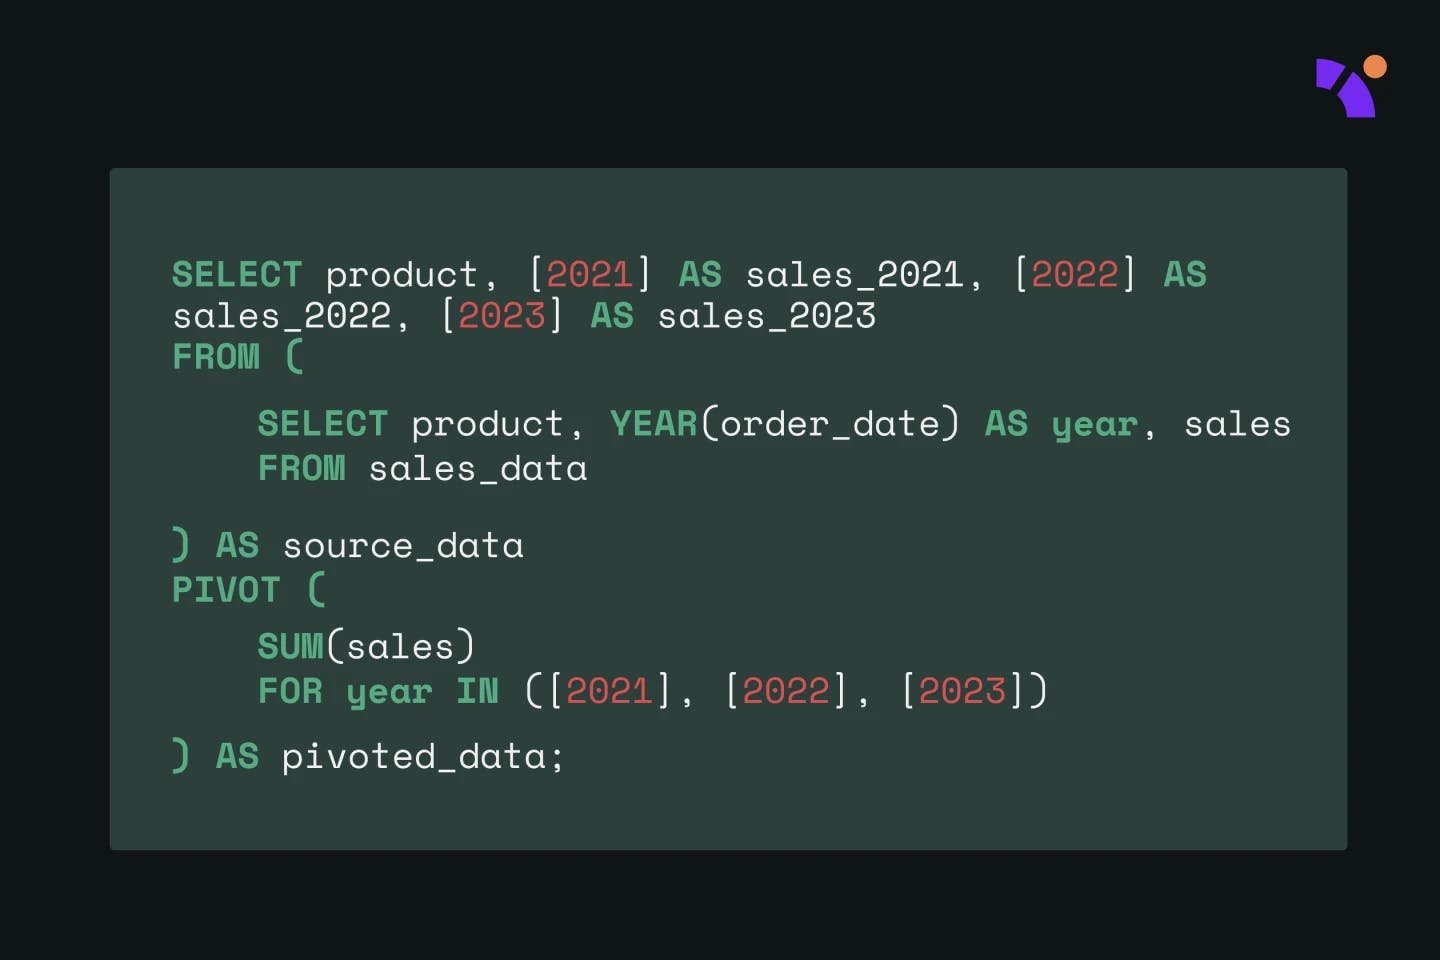
Imagine you have a sales dataset containing information on order dates, product names, and sales totals. You want to create a summary table that displays the total sales by product and year, making it easier to analyze yearly sales trends for each product. In this case, you can use PIVOT to aggregate the total sales by product and year:
SELECT
 product,
 [2021] AS sales_2021,
 [2022] AS sales_2022,
 [2023] AS sales_2023
FROM
 (
  SELECT
    product,
    YEAR(order_date) AS year,
    sales
  FROM
    sales_data
  ) AS source_data
  PIVOT
  (
    SUM(sales) FOR year IN ([2021], [2022], [2023])
  ) AS pivoted_data;
UNPIVOT, on the other hand, is used to transform columns into rows, effectively “melting” your data into a longer format. It is particularly useful when you need to normalize data or convert wide datasets with multiple columns into a more standardized structure for further analysis or use.
Here’s an example of how you can use UNPIVOT to convert a wide dataset with separate columns for each year’s sales back into a long format:
SELECT
  product,
  year,
  sales
FROM
  (
    SELECT
      product,
      sales_2021,
      sales_2022,
      sales_2023
    FROM
      sales_by_product_year
  ) AS source_data
  UNPIVOT
  (
    sales FOR year IN (sales_2021, sales_2022, sales_2023)
  ) AS unpivoted_data;
In this example, UNPIVOT is used to transform the sales columns for each year back into rows, returning the dataset to its original long format.
Not only does incorporating PIVOT and UNPIVOT in your SQL toolkit enable versatile data manipulation, but it also enhances efficiency. These functions offer elegant and concise solutions for data aggregation and restructuring, saving time and simplifying your code. By employing PIVOT and UNPIVOT, you can perform complex data transformations more effectively and cater to various analytical requirements with ease.
Wildcard functions
Wildcard functions in SQL are powerful tools that enable you to perform pattern matching and data filtering based on specific conditions. These functions, such as LIKE, PATINDEX, and CHARINDEX, are particularly useful for searching, extracting, and modifying textual data within your database, allowing you to identify and manipulate records that meet certain criteria.
LIKE is a widely used wildcard function for pattern matching, enabling you to filter and retrieve records that contain specific characters or patterns. The LIKE operator, used in conjunction with the “%” (percentage) and “_” (underscore) wildcards, allows you to search for data based on various patterns:
SELECT
 first_name,
 last_name
FROM
 employees
WHERE
 last_name LIKE 'S%';
In this example, the LIKE operator is used to retrieve employees whose last names start with S. The “%” wildcard represents any sequence of characters, while the “_” wildcard represents a single character.
To search for special wildcard characters (such as “%” and “_”) as literals within a string, you can use the ESCAPE keyword. This allows you to define an escape character, which helps you treat wildcard characters as literals instead of their usual function as wildcards.
For instance, if you want to search for email addresses containing an underscore, which is normally treated as a wildcard, you can use the ESCAPE keyword to specify an escape character:
SELECT
 email
FROM
 users
WHERE
 email LIKE '%\_@%' ESCAPE '\';
In this example, the backslash is used as the escape character. The query searches for email addresses containing an underscore followed by an “@” symbol. The backslash indicates that the following underscore should be treated as a literal character and not as a wildcard.
PATINDEX and CHARINDEX are other useful wildcard functions that help you search for specific patterns or characters within a string. Both are string functions used to find the starting position of a pattern or character within a given string. However, there are some differences between the two functions.
CHARINDEX locates the starting position of a specified substring within a string without supporting pattern matching or wildcard characters. It is primarily used to find the position of a specific, known substring.
Conversely, PATINDEX supports pattern matching using wildcard characters, allowing for the search of a pattern’s starting position that matches a specified wildcard pattern within a given string. This makes PATINDEX more flexible and powerful for complex pattern-matching tasks.
Here are examples to illustrate the differences:
Using CHARINDEX to find the position of “@”in an email address:
SELECT
 email,
 CHARINDEX('@', email)
AS
 position_of_at_symbol
FROM
 users;
Using PATINDEX to find the position of the first digit in a product name:
SELECT
 product_name,
 PATINDEX('%[0-9]%', product_name)
AS
 position_of_first_digit
FROM
 products;
It is worth mentioning that some SQL dialects have additional, dialect-specific wildcard functions. However, this section focuses on widely-used functions to ensure broader applicability.
Wildcard functions are essential for effective pattern matching and data filtering in SQL. They provide the flexibility to search, extract, and modify data based on specific conditions or patterns. By mastering wildcard functions, you will save time and enhance your SQL skills, allowing you to perform complex data transformations and uncover deeper insights from your data. These functions can significantly reduce the amount of code needed for repetitive tasks, such as UNION ALL operations on hundreds or thousands of similar tables, making your work more efficient and streamlined.
LEAD and LAG
Last but not least, we’ll discuss the LEAD and LAG window functions, which play a crucial role in comparing data from different rows within your SQL queries. These functions allow you to access the values in the rows before or after the current row within a result set, making it easy to compare data across rows without resorting to self-joins or other less efficient methods.
LEAD is used to access the value in a specified column for the row that is N rows after the current row, while LAG is used to access the value for the row that is N rows before the current row. Both functions take two arguments: the column name and the number of rows to lead or lag (with a default value of 1 if not specified).
These functions can be particularly useful for calculating differences, growth rates, and other relative metrics in data transformation tasks. Let’s look at some examples to illustrate their utility.
Suppose you have a dataset containing monthly sales data and you want to calculate the month-over-month growth rate for each month. You can use the LAG function to access the previous month’s sales and calculate the growth rate as follows:
SELECT
 month,
 sales,
 (sales - LAG(sales) OVER(ORDER BY month)) / LAG(sales) OVER (ORDER BY month) * 100 AS growth_rate
FROM
 monthly_sales;
In this example, the LAG function retrieves the sales value from the previous month, allowing you to calculate the month-over-month growth rate directly in your query. The growth rate is calculated as the difference between the current month’s sales and the previous month’s sales, divided by the previous month’s sales, and multiplied by 100 to express it as a percentage.
Another example might involve a dataset containing information about scheduled maintenance events for a fleet of vehicles. You might want to calculate the number of days between each maintenance event for each vehicle. You can use the LEAD function to access the date of the next maintenance event and calculate the difference in days as follows:
SELECT
 vehicle_id,
 maintenance_date,
 LEAD (maintenance_date) OVER(PARTITION BY vehicle_id ORDER BY maintenance_date) - maintenance_date AS days_to_next_maintenance
FROM
 maintenance_schedule;
In this example, the LEAD function retrieves the maintenance date for the next event in the sequence for each vehicle, allowing you to calculate the number of days between the current maintenance event and the next one directly in your query. By using the PARTITION BY clause, you ensure that the calculations are done separately for each vehicle, providing a clear view of maintenance intervals for the entire fleet.
By effectively using LEAD and LAG, you will be able to streamline your queries, reducing the need for complex, resource-intensive operations like self-joins or subqueries. This can lead to improved query performance and more efficient data processing.
Why mastering SQL elevates your data transformation skills
Mastering SQL and its powerful functions elevates your data transformation skills by allowing you to efficiently manipulate, analyze, and transform data to uncover valuable insights. By incorporating these essential functions into your day-to-day work, you can improve the quality and consistency of your data, create more complex and efficient queries, and perform advanced analyses with ease and speed.
As a data professional, investing time in honing your SQL skills will undoubtedly pay dividends in your ability to deliver impactful and actionable insights from your data.
Elevate your data transformation with advanced SQL techniques
In this article, we’ve covered five essential SQL functions that can greatly enhance your data transformation capabilities:
- NTILE: Distributes rows into a specified number of equally sized groups, enabling easy segmentation and analysis of data in quantiles or other partitions.
- PARTITION BY: Divides the result set into partitions to which other window functions can be applied, allowing for calculations and analysis to be performed within specific subsets of data based on one or more columns.
- PIVOT and UNPIVOT: Transforms data from rows to columns (PIVOT) or from columns to rows (UNPIVOT), simplifying data analysis and presentation by reorganizing data structures.
- Wildcard functions: Enable powerful pattern matching and data filtering based on specific conditions or patterns. These functions are particularly useful for identifying and manipulating records that meet certain criteria, saving time and effort in complex data transformations and analyses.
- LEAD and LAG: Compares data from different rows by accessing values in the rows before or after the current row, enabling calculations of differences, growth rates, and other relative metrics.
As a data professional, continuous learning and practice are crucial for staying ahead in the fast-paced world of data analysis. Implementing these SQL techniques in a powerful data modeling platform, like the one offered by Y42’s Modern DataOps Cloud, can further elevate your data transformation skills. With Y42, you can harness the power of SQL and leverage its advanced functions to generate impactful insights and make data-driven decisions.
Category
In this article
Share this article