
Modern data stacks have grown in popularity since we realized how important data really is to a business. They came about as we moved from on-prem data storage to the cloud, allowing us to access our data quicker and easier than ever. These stacks have now enabled us to move data at record speed, from the creation of the data all the way to the insights that we draw from it.
Modern data stacks allow us to automate the process of ingesting, transforming, and scheduling data. Not only do they make it easier to create a seamless workflow that delivers insights in the blink of an eye, but they also allow for a real-time picture of our data. We no longer have to wait days or weeks to receive last week’s numbers or reports. We can make decisions for our business based on what consumers need now.
There is no question that the modern data stack holds a lot of value, but how do we reach that point? What are the technical pieces that allow for automation and instant access to data we trust? In this article, I’ll be walking you through the pieces of the puzzle. More specifically, we will discuss the role of a data warehouse in the data stack, ingestion, transformation, orchestration, and monitoring. Lastly, you will understand how all of these pieces fit together to make visualization (the last part of the stack) possible. I will even introduce you to a tool that allows you to use all of these pieces cohesively within one platform.

Data warehouse
The data warehouse is your modern data stack’s hub. Nothing can reach your data without accessing the warehouse. It’s the one thing that connects all the other pieces to each other.
Your ingestion tool will load data into your data warehouse. Your transformation tool will aggregate, join, and manipulate tables within this warehouse. Your monitoring and orchestration tools will deploy your data models to various locations within your warehouse. And lastly, your visualization tool will connect to it directly in order to display the transformed data.
All data is flowing in and out of your data warehouse. You need to pick one that’s hosted on the cloud and accessible by anyone, anywhere. We no longer want to depend on a specific location to store and transform our data.
With this, it is also extremely important to monitor who has access to your data warehouse. Typically, access is only for people in the data team, such as data analysts, analytics engineers, and data engineers. It is best to minimize who has access to this hub.
Ingestion
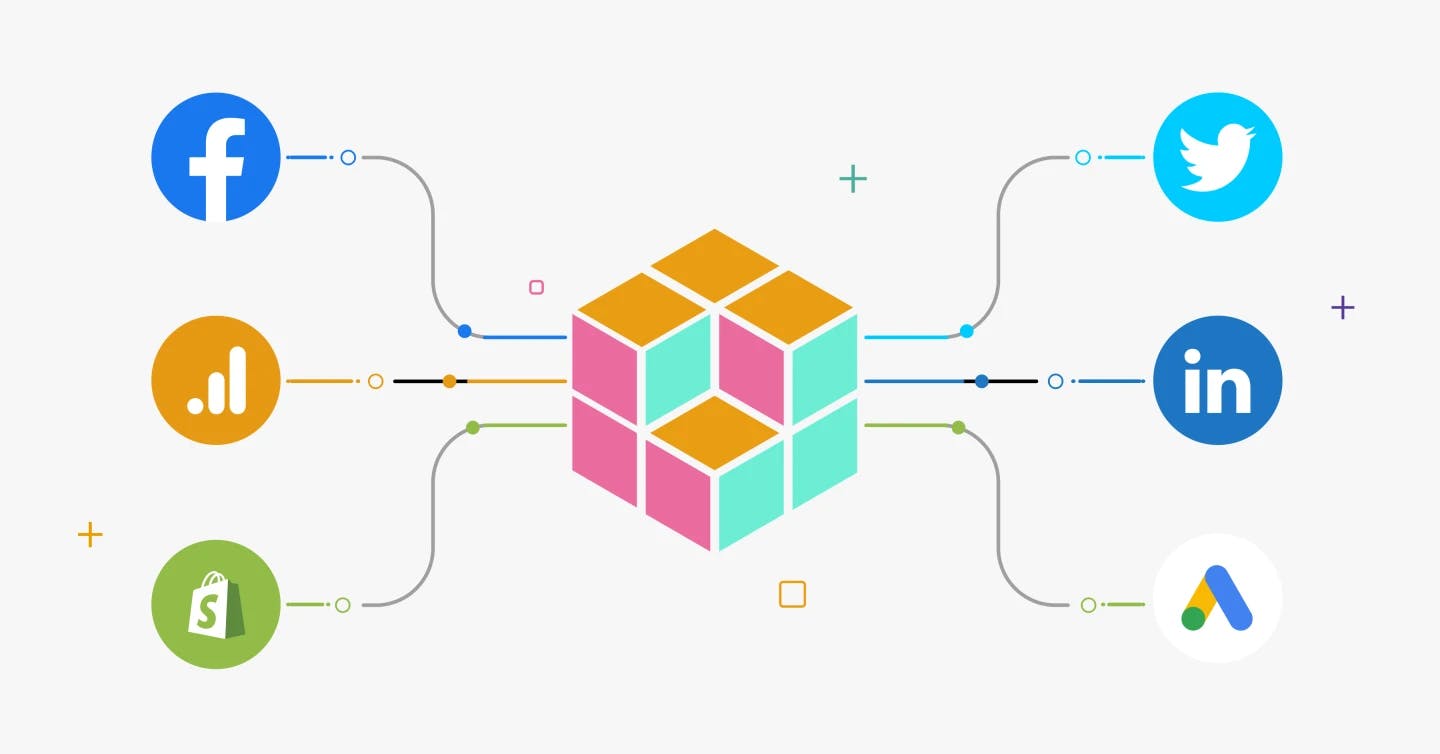
Ingestion serves to move your data from its original sources — such as Google, Facebook, or an Azure database — to your data warehouse. Once you have your warehouse set up, you can focus on ingesting raw data into it. Looking for a platform that normalizes your schemas is important. This will ensure you always have clean, usable data in your warehouse.
You also want to look for a platform that allows for incremental updates. This means only new rows of data will sync rather than all the historical rows that have already been imported. Incremental updates help speed up your data pipeline and reduce computing resources. Y42 offers both of these features, as well as logs to help debug and extensive support if something goes wrong.
Transformation
Transforming the data ingested into your data warehouse involves running different SQL queries to aggregate data, join tables, and perform calculations. The purpose of transforming your raw data ingested out of the APIs is to make it easier for analysts to use. Instead of performing complex calculations and joins within the visualization or reporting tool, they can put it into a format that is easily used for reporting and building dashboards. Defining core business calculations within different data layers also helps to standardize KPIs across the company.
When talking about data models, you will typically see three different layers — staging, mart, and analytics. Within the staging layer, you are preparing the data to be analyzed. This includes cleaning, filtering, and renaming any raw data ingested by the APIs. This layer is imperative in maintaining a clean data environment for analysts and engineers to use.
Your mart layer is where you build in internal business logic. This would include key calculations, aggregations, and joins. This is the layer where you standardize your KPIs to be used across different parts of the business, defining a calculation that remains consistent for users.
Lastly, your analytics layer directly relates to how you build reports and dashboards. If there is a more specific way to filter or aggregate the data in the mart layer, you would do this in the analytics layer. For example, let’s say you have a data model that calculates the costs of different business areas. However, the marketing team wants a dashboard that only displays their costs so they can ensure they are keeping pace with their budget. You would filter the financial model created in your mart layer to only include marketing spending.
Orchestration
Once you’ve written your transformations, you need to find a way to schedule them so they run every day, or however frequently you decide. You want your models to reflect the new data you ingest into your warehouse, too. Orchestration is essentially a way to automate your data ingestion as well as your data models.
Orchestration also does a great job of handling dependencies between your data syncs and data models. Let’s say you have a model that pieces together various web sessions from different users. This model depends on click and page view data. Orchestration would allow you to set a dependency on these two datasets. That way, the model won’t run until the latest click and page view data has been ingested. This ensures your models reflect the most recent data, rather than missing pieces of it.
Y42, for instance, has extensive built-in orchestration features for managing dependencies. It automatically creates and connects dependencies within your data pipeline, minimizing the manual work necessary to set them. It also automates the triggers between these dependencies, allowing you to set them up with a simple drag-and-drop feature.
Orchestration services usually allow you to kick off your data pipeline at certain time intervals. I like to kick mine off every 24 hours — that way, the latest data is waiting in my data warehouse each day. Some platforms like Y42 also allow you to continuously load your data into your data warehouse for real-time analyses.
Click here to learn more about how to save time by automating your data pipelines.
Monitoring
Monitoring and orchestration go hand in hand. Monitoring is not often included in the suite of modern data stack tools because many orchestration tools have built-in monitoring capabilities. However, I think distinguishing the two is vital. Orchestration exists for running a data pipeline at a certain time, ensuring dependencies are honored. Monitoring can cover all the different aspects of the data stack, not just orchestration.
When considering data monitoring, it is important to look at where things could go wrong in your data pipeline. Poke holes in your own data stack! In which steps are you most concerned about data quality? How can you ensure your data models are giving you the correct results? These are just a few of the questions that you need to ask yourself.
One way you can monitor your data pipeline is by using your orchestration tool. The tool should tell you when your models or syncs are failing and the specific errors they are failing with. Platforms like Y42 make this easy by automatically spotting integration issues, alerting you to them then telling you how to fix them.
Setting dependencies within your orchestration should also prevent downstream issues. The goal of monitoring is to always catch the upstream error rather than the downstream error. Catching any issues upstream will prevent hours of parsing through code, trying to pinpoint the problem.
Visualization
The last piece of the modern data stack puzzle is visualization, where all your hard work is displayed. This is the tool that business users are directly interacting with to draw important insights from your data models. Your visualization tool connects directly to your data warehouse, pulling data from your data sources as well as your data models.
Automating your data models and storing them in your data warehouse makes real-time visualizations possible. It also helps prevent any lag you may find when your data models are directly written in your visualization platform. I’ve seen data models written within visual tools that take 36 hours to run. This obviously isn’t helpful for anyone. The goal of the modern data stack is to prevent instances like this!
I’m a firm believer that less is always more with data visualizations. You want to create as few visuals as possible in order to communicate business value. Often, as data professionals, we need to push back against business users when they request certain one-time charts or dashboards. The goal is to only create dashboards that can be reused for months to come. This is why you should look for features that help you drill-down KPIs and filter your datasets.
Think about repeatability and scalability whenever you’re creating a visualization. After all, the entire purpose of a modern data stack is to streamline data and make it easier to share and understand. Y42 offers easy export capabilities as well as access control for your graphs, ensuring you can collaborate across teams on key visualizations.
The modern data tool
Modern data stacks are powerful when all the individual tools come together to produce reliable, high-quality data for the business to act on. Ingestion, transformation, and orchestration all integrate to create streamlined, automated data models that we can rely on. A data warehouse sits at the center of it all, feeding in data, transforming it, and producing data to be used by the visualization tool. The visualization tool then utilizes the data models to turn them into clear, communicative dashboards for marketing, sales, and product teams to convert into real insights.
Without each of these pieces, business teams wouldn’t be able to squeeze maximum value out of their data. Better yet, platforms like Y42 give you access to all these different tools within one interface, making it easy for all types of users to navigate. Y42 allows you to ingest, transform, orchestrate, export, monitor, AND visualize data within a platform that sits on top of your cloud data warehouse.
The only thing worse than not having a modern data stack in place is having an outdated one, or even one with poor-quality data that nobody can rely on. If you want to stay on top of your data in one single platform with the power of a best-of-breed data stack, why don’t you book a call with Y42 experts to find out more about this innovative solution?
Category
In this article
Share this article