
When running an ecommerce shop, it’s crucial to track and understand online shopping trends and changes in customer behaviors in order to make better decisions for your business. You not only need to attract new customers to your website, but you also need to keep them there and make sure they come back to purchase your products again.
How do you learn how to optimize your website and marketing efforts, what kind of sales and campaigns to run, and which products to stock or ditch? (Essentially, what do you do to guarantee the sustainable growth and success of your business?) You kickstart your ecommerce analytics journey, of course.
Ecommerce businesses start accumulating data the moment they begin operating. You can follow the behavior of your customers in your online shop in Google Analytics; your ecommerce platform (Shopify or Magento, for instance) holds your order lifecycle information. Google Ads, Facebook Ads, TikTok Ads, etc., all have insights into the performance of your marketing campaigns.
The data is there; you just need to learn how to leverage it and put it to good use. Through ecommerce analytics, you can inform your sales, marketing, and company-wide strategies, operating in a data-driven way that allows you to make informed decisions instead of playing a guessing game.
This is how you get started with ecommerce analytics:
- Centralize your data sources
- Define your ecommerce KPIs
- Take the time to understand your customers
- Set up proper website tracking
- Start analyzing your ecommerce data
- Summarize and present your findings
- Make sure you are using the right tools and processes
7 steps to get started with ecommerce analytics
Step 1: Centralize your data sources
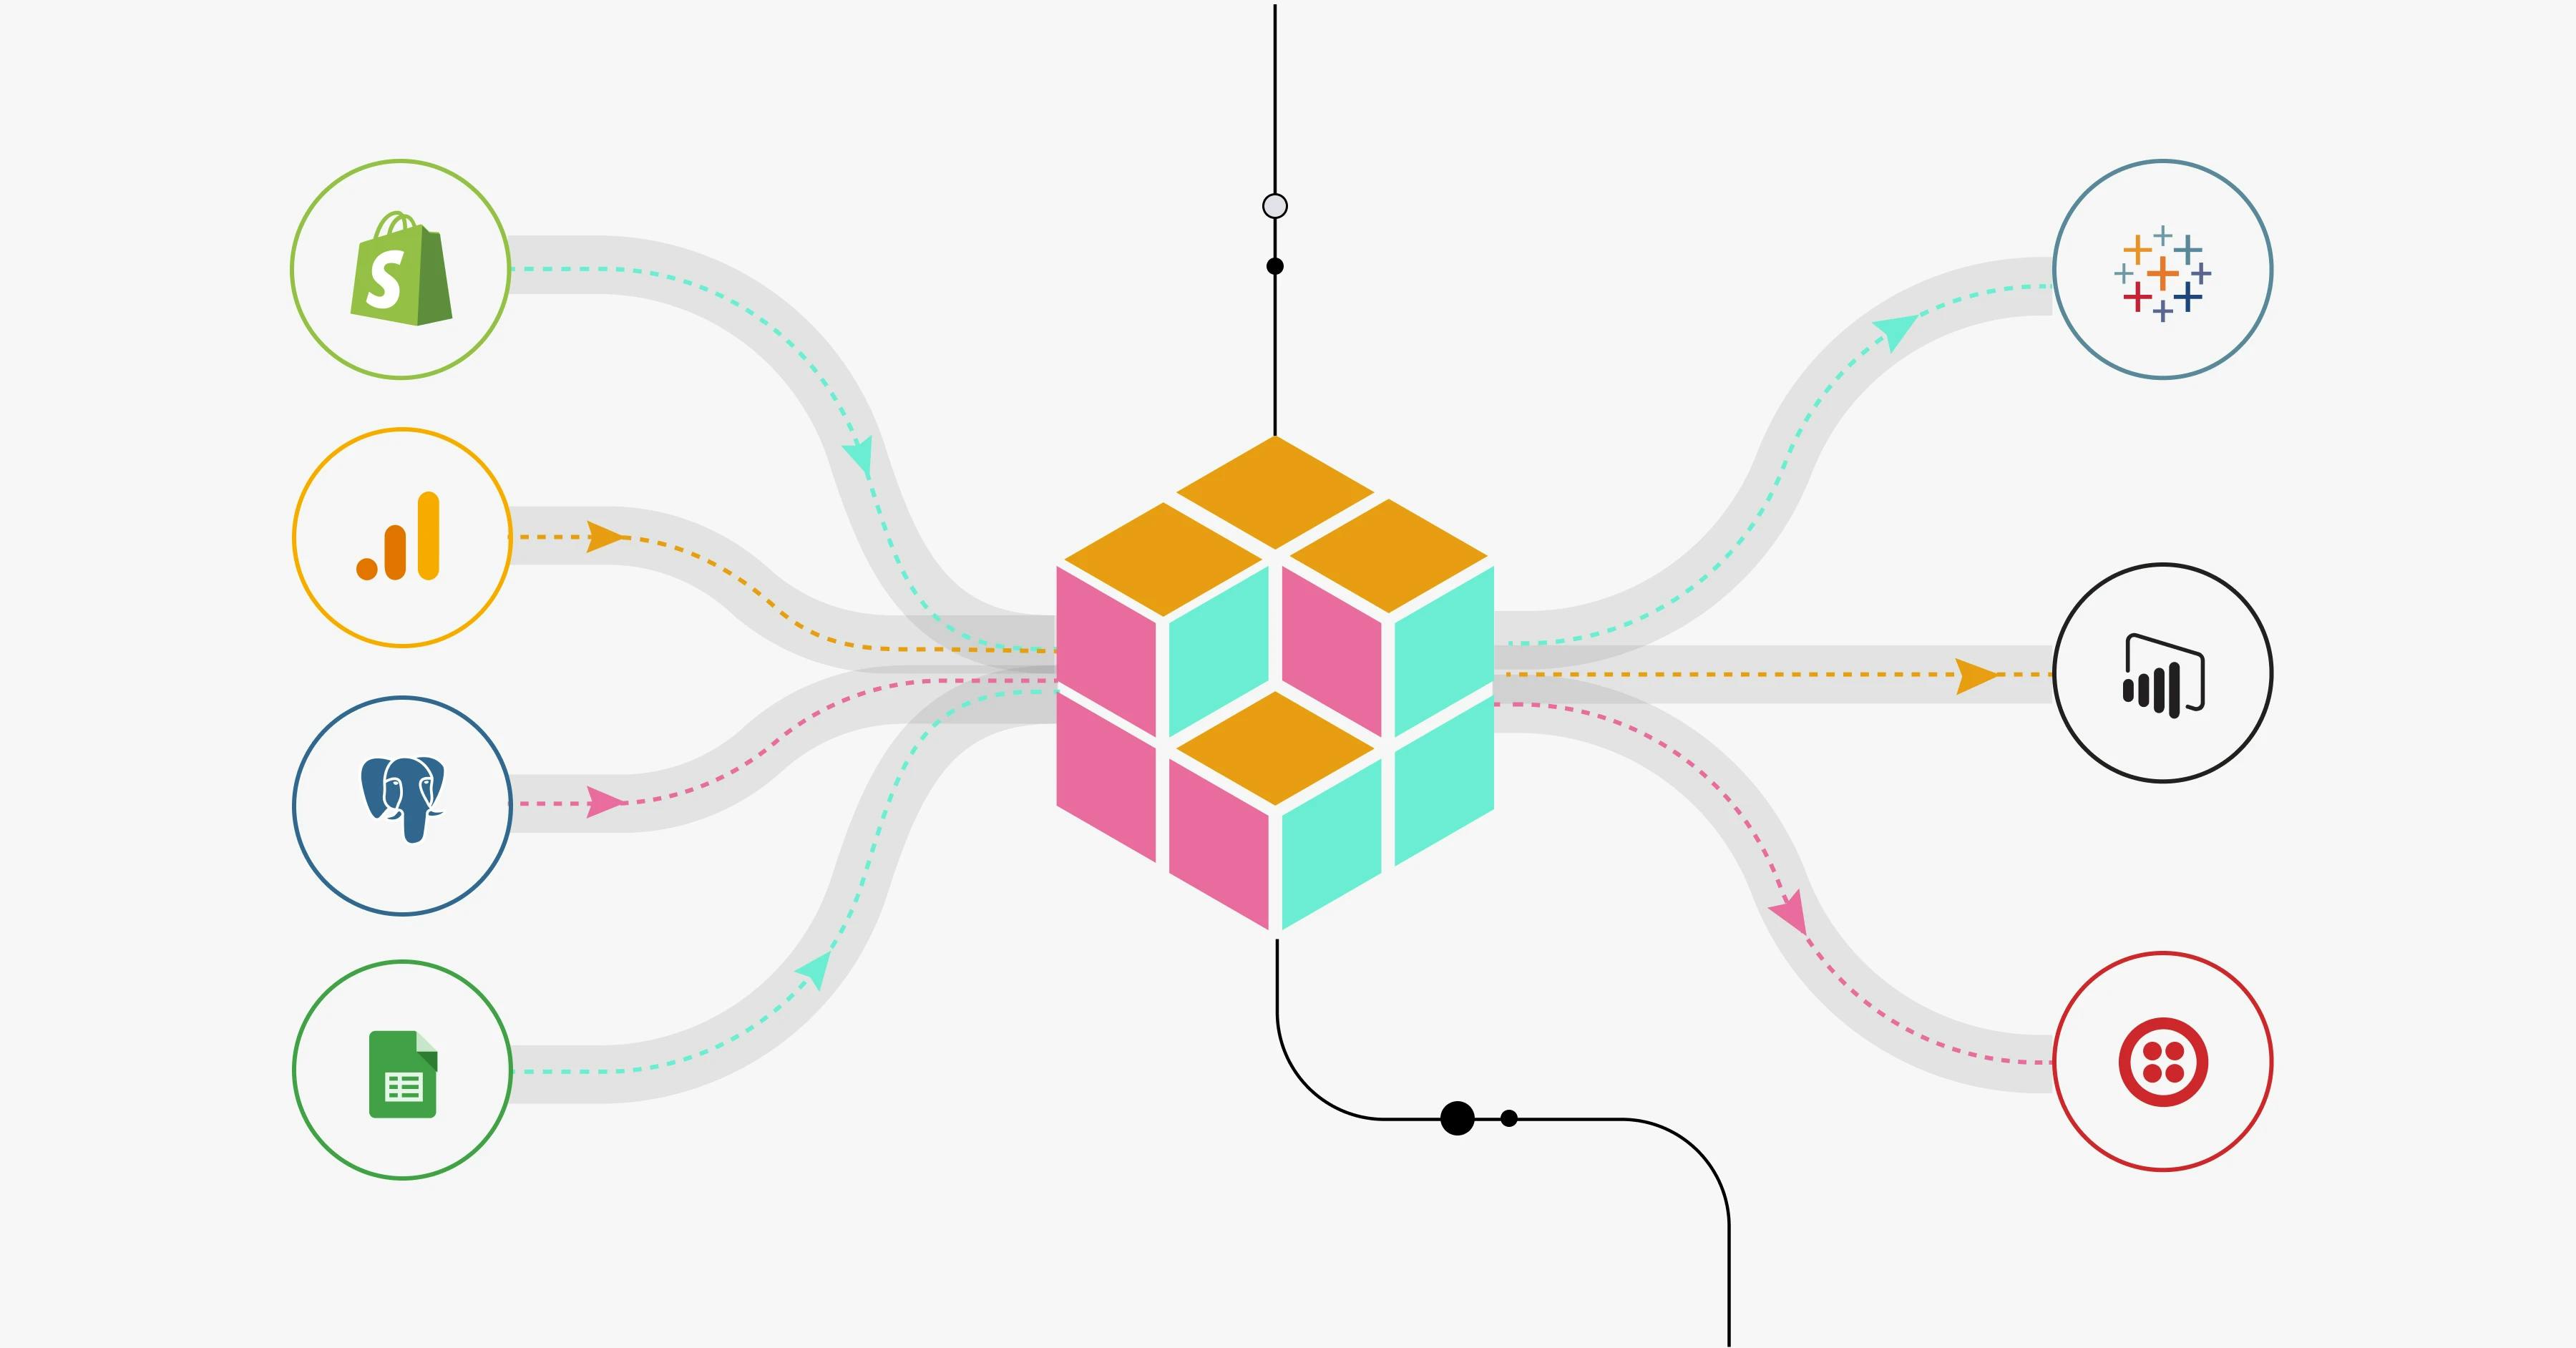
This might sound obvious, but the first thing you need to do when you start your ecommerce analytics journey is to gather all of your shop’s data into one place. Your data will be scattered around different platforms and channels, so to enable a smooth analysis process, it’s crucial to centralize all of your data sources.
Our best practice recommendation would be to ingest all your data into a cloud data warehouse (like BigQuery or Snowflake). This way, your raw data is safely stored in an infinitely scalable space that can be easily accessed and connected with your data modeling and visualization tools. These would be the steps you’d follow when working on your data after having gathered all of your sources.
Many businesses use spreadsheets to collect and transform their data, especially in the earlier stages of their venture. However, if your company continues to scale, there will come a time when spreadsheets are no longer viable. When this happens, you might want to look into a more powerful analytics tool — like Y42 — that allows you to take care of all the relevant steps in your data pipeline.
Step 2: Define your ecommerce KPIs
Across an organization, teams usually work with various platforms, and each platform has a different definition and naming convention for the metrics they keep track of.
For instance, let’s say you want to compare the cost of your ads per day on Google Ads and Facebook Ads. You will find that Google names the column showing how much you spent as cost, whereas Facebook names it amount spent. When building your data model, merging both columns would be easier if they both had the same name. In situations like this, you would need to consolidate a unified naming convention.
As for confusing metric definitions, the way Shopify defines net sales might not match the way your business defines net revenue. Our internal understanding of net revenue is revenue excluding taxes, discounts, cancellations, and returns. Shopify, meanwhile, refers to net sales as revenue after discounts and returns but including taxes. In our opinion, Shopify’s definition is misleading because it includes taxes in the net sales metric.
However, it’s not just the platforms themselves that have diverse names and definitions for the same metrics. Internally, different teams might be looking at the same KPIs and naming or defining them in their reports completely differently.
If you don’t align as an organization on company-wide naming conventions and metric definitions, you risk finding yourself with team-specific silo reportings.
Our best practice tip is to come up with a key metrics definition glossary that reflects your business logic. This glossary will help you put fundamentals in place and ensure that everyone in the organization builds reports on the same base, following the same key metric principles.
Step 3: Take the time to understand your customers
As an ecommerce or DTC business, your customers are your most valuable source of information. The way customers behave on your website, the orders they place (and the ones they don’t), the reviews they write for your products — these are all golden nuggets of data that will allow you to:
- Optimize your website for customer retention and improve it to provide the best customer experience possible.
- Change or upgrade the products that are getting less love from your customers.
- Promote your best-sellers.
- Evaluate which products you should discontinue, which ones you should keep restocking, and what kind of new products your customers are likely to buy.
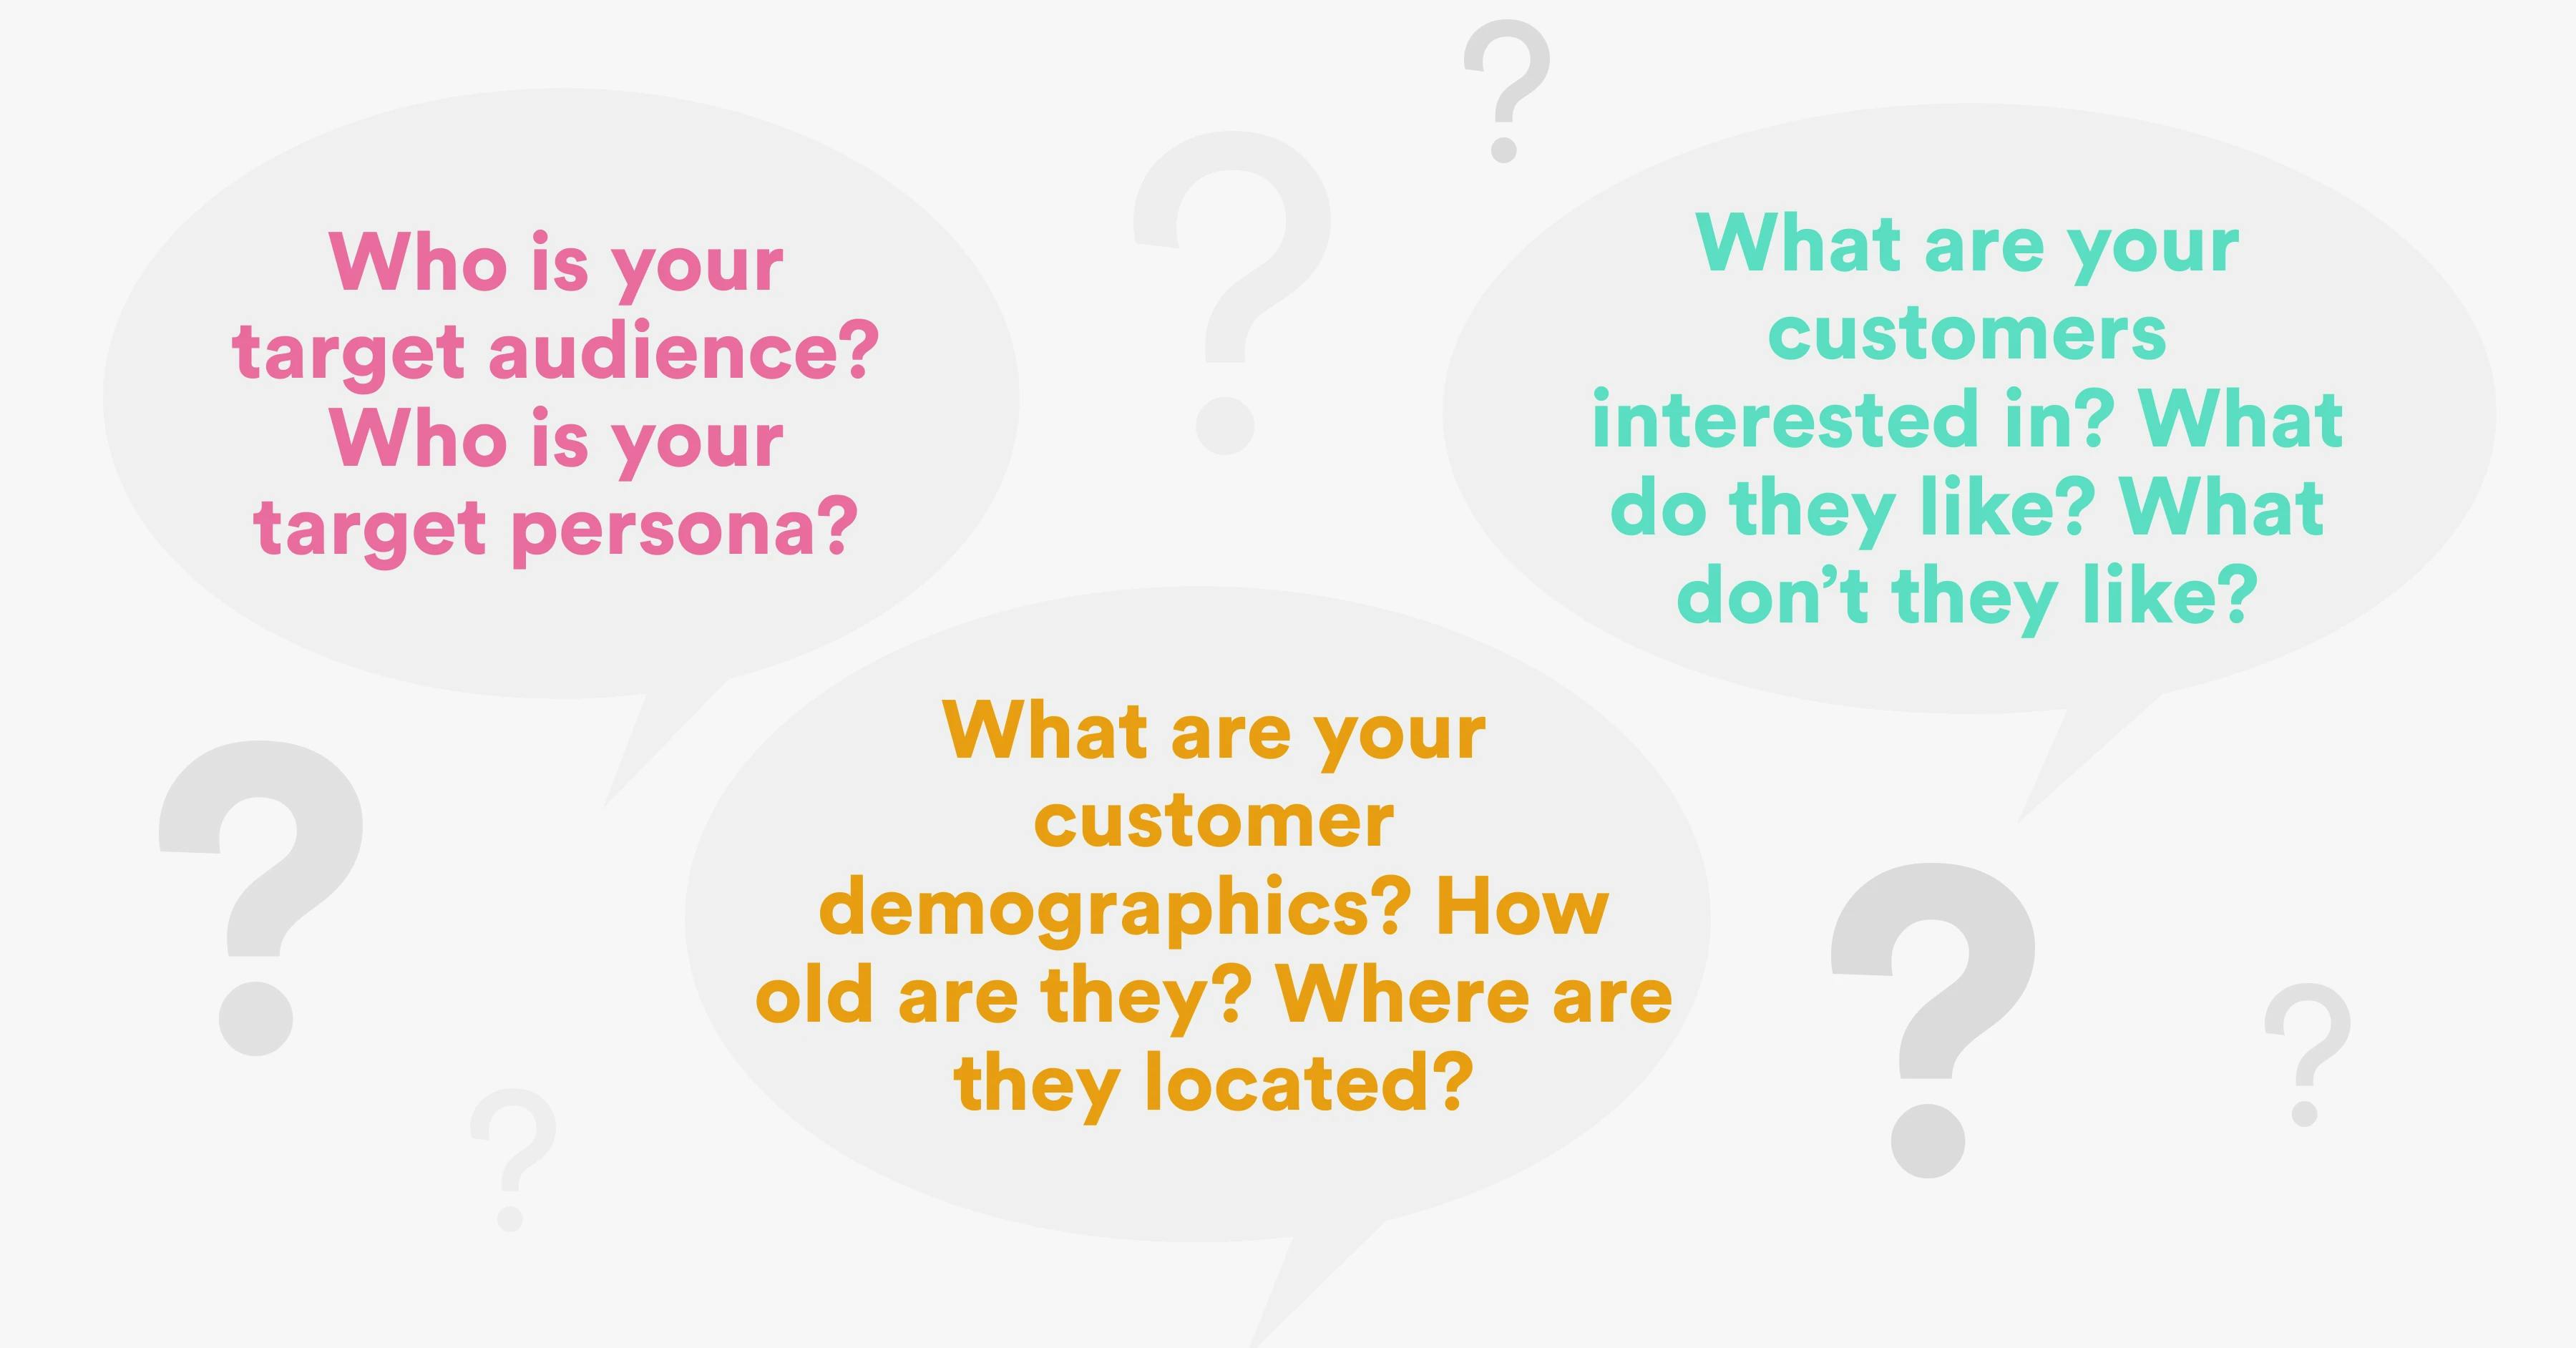
But in order to make the most of your customer data, you need to know your customers inside out:
- Who is your target audience? Who is your target persona?
- What are your customer demographics? How old are they? Where are they located?
- What are your customers interested in? What do they like? What don’t they like?
Knowing the answers to these questions will show you, for instance, which kind of social media channels (if any) you should promote your products on. Let’s say your customers are between the ages of 15 and 25 — in this case, TikTok might be the best place for you to promote your business.
What’s more, if you have customers located in different time zones, you might want to adjust your email marketing to send your messages at different times so that you reach your clients when they’re most likely to check their inboxes.
The same goes for the type of campaigns you run. If your customers are socially aware and interested in topics surrounding sustainability and the environment, you might want to design campaigns around these subject matters. You could highlight your sustainability practices, what you do to guarantee fair employee wages, how you handle your carbon footprint, etc. Showing your customers that you care about the same things as them will allow you to resonate with them more.

Step 4: Set up proper website tracking
As stated in step 3, your customers are your biggest source of data, so you want to be able to access that information. In order to understand the behavior of your customers in your online shop, you need to first be tracking it.
If you haven’t done so already, go ahead and set up your Google Analytics ecommerce tracking. ASAP! By tracking your customers’ journey in your webshop you can learn:
- Which products people are buying
- How much money they are spending on your store on average (AOV)
- What your conversion rate is
- How much time it takes them to purchase an item
- Which products they add to their carts but don’t purchase
- Which discount codes they’re using (if any)
- How long they spend on your website, which tabs they visit, how quickly they exit your website, and when they leave the website
You can gather all of these insights and more by tracking your ecommerce website in Google Analytics.
Step 5: Start analyzing your ecommerce data
You’ve gathered your data, you’ve defined your metrics, you understand your customers, and you’ve set up your tracking, so now it’s time to look at the numbers and extract actionable insights from them.
After the data integration process comes the data transformation step. Make sure you clean, normalize, and unify the data coming from your different sources. During the modeling step, you should also be able to merge relevant data sources with each other and perform calculations that will enrich your analysis.
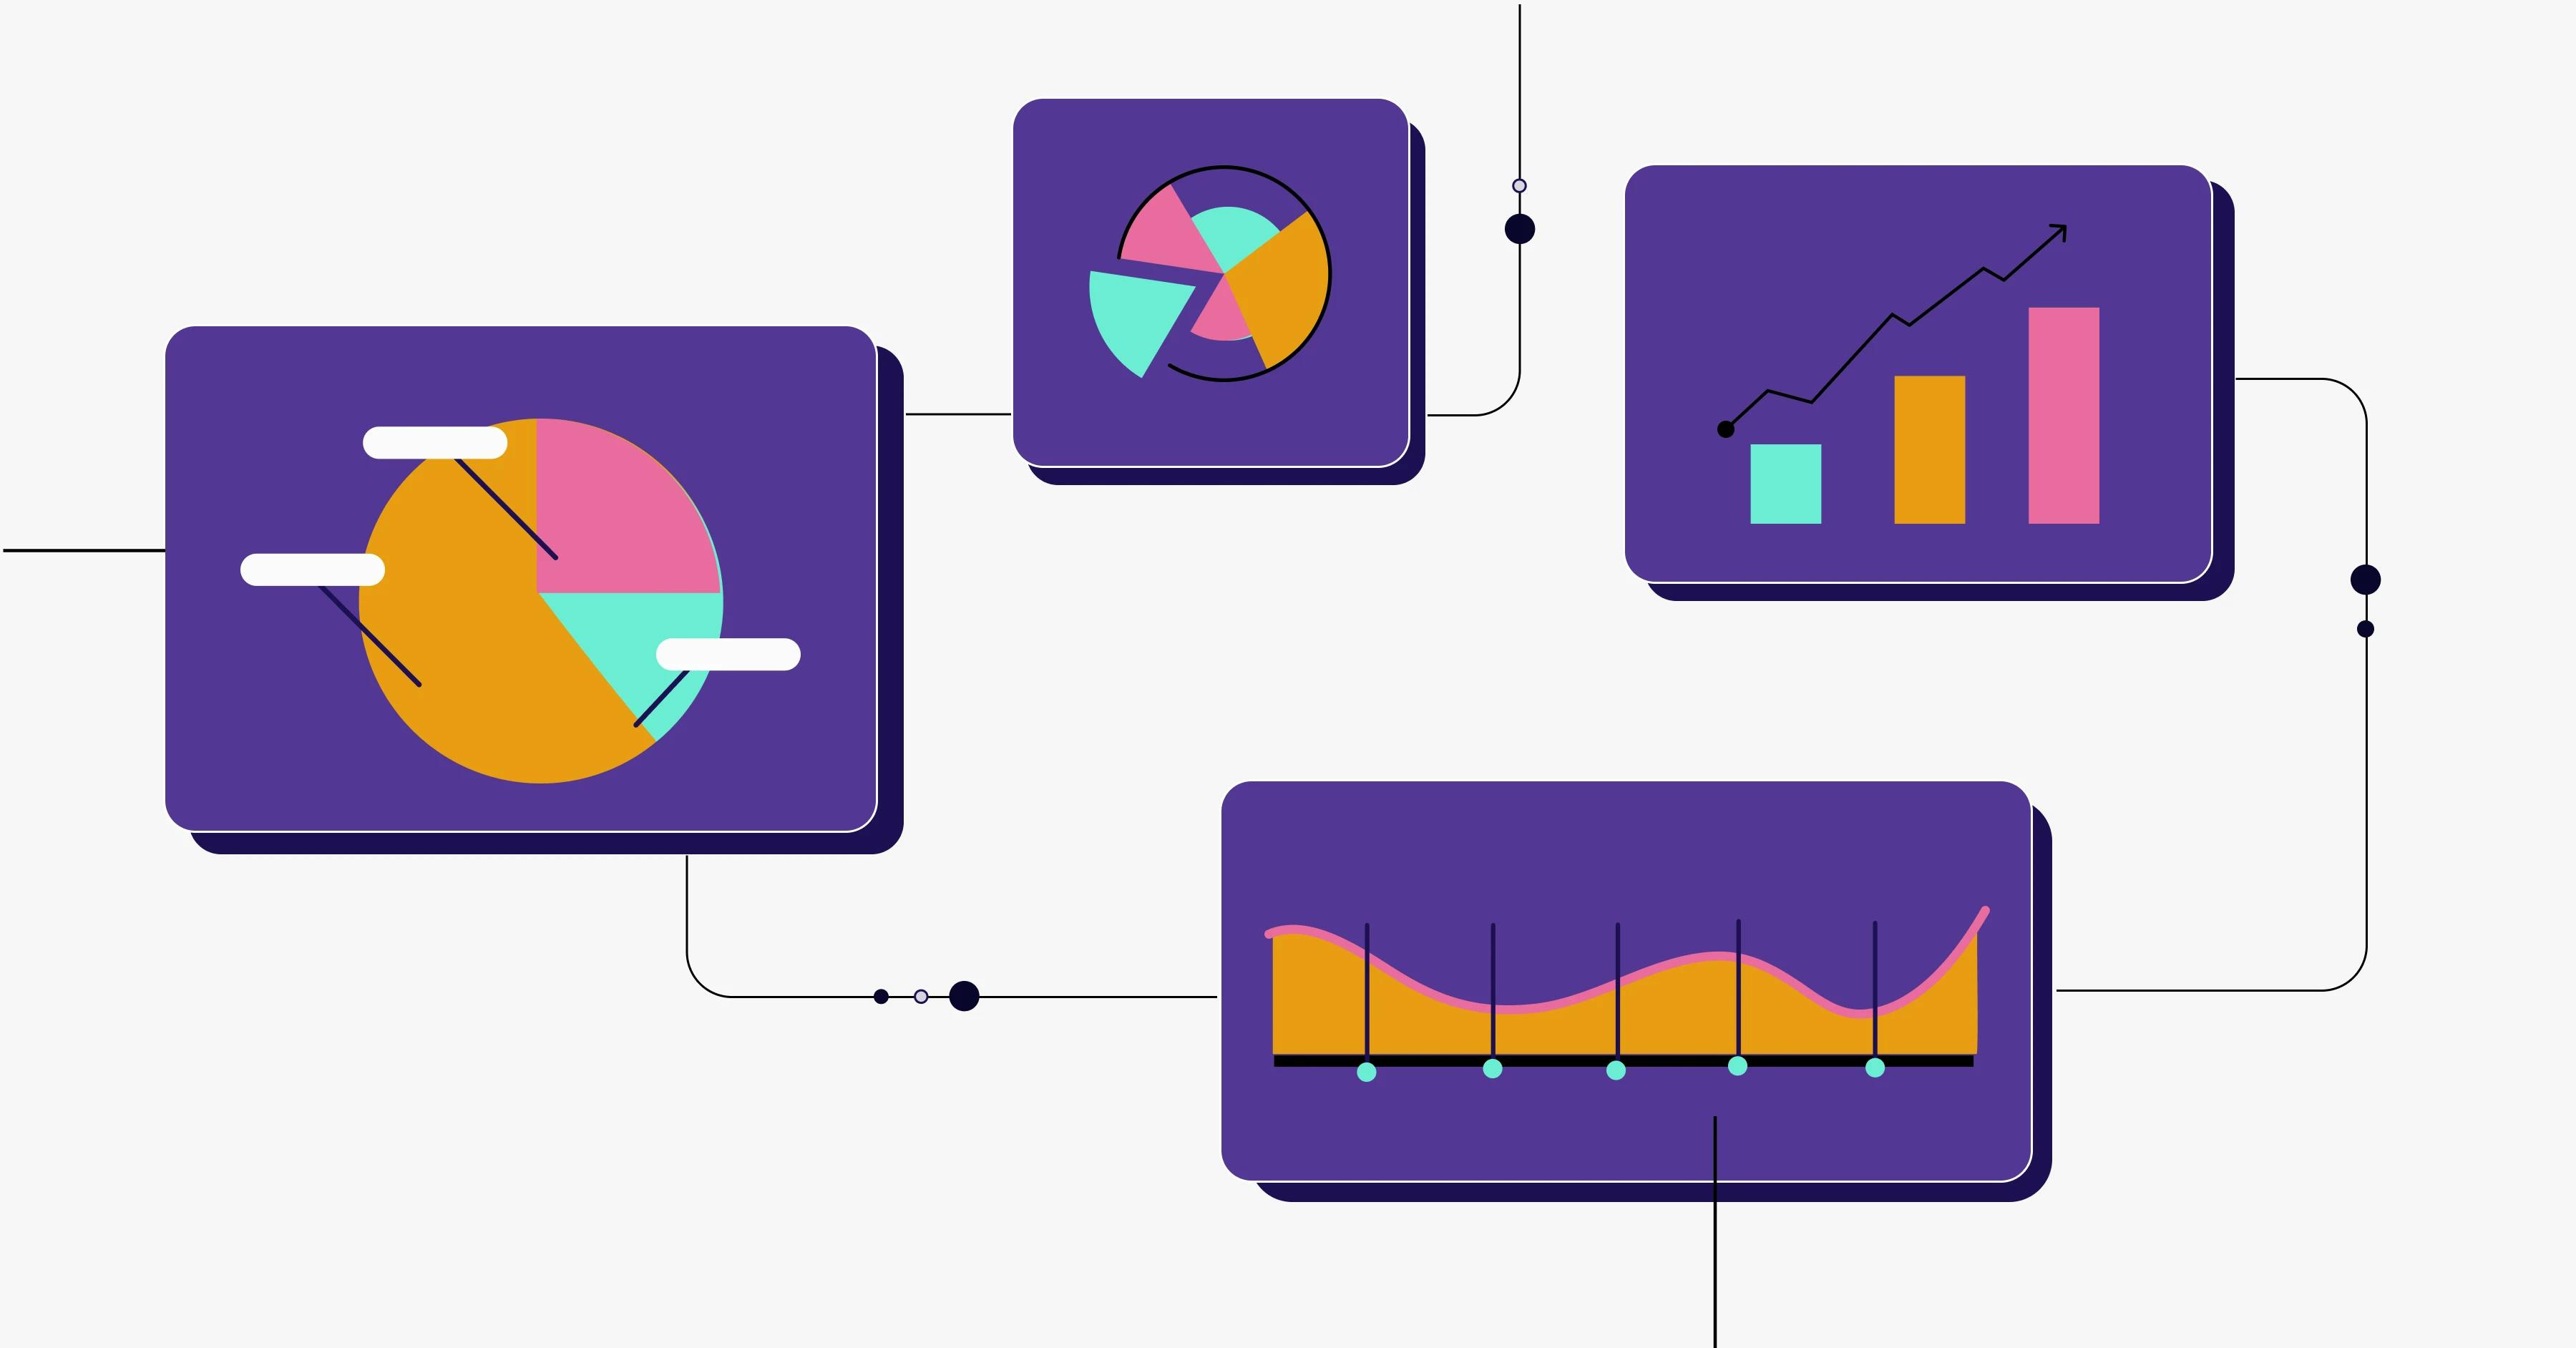
Once you have a clean dataset, you can start working on your visualizations and use the dashboards you build to discover trends, anomalies, patterns, and actionable opportunities. Some typical ecommerce dashboards include:
- Website analytics dashboards
- Revenue dashboards
- Supply chain dashboards
- Order lifecycle dashboards
- Sales performance dashboards
- Marketing performance dashboards
Step 6: Summarize and present your findings
Once you have interpreted the data, it’s time to organize your main findings in a more structured way. After conducting your analysis, you should be able to craft a story that presents the essential facts and learnings derived from it.
When you’re sharing your analysis with the team, the magic will happen when you start connecting the data insights you have gathered with your customers and their behavior. Remember, though, not to draw conclusions that go beyond what the data shows. Also, make sure you use attractive and easy-to-digest visuals in your reports so that you can explain your results and convey your message more efficiently.
Step 7: Make sure you are using the right tools and processes
The best way to get the most valuable insights from your ecommerce analytics data is to use the right tools and processes. You’ll have so much data to work with that you’ll need a place where you can centralize it all. Also, because you’ll be building so many reports for different teams and everyone will want to stay on top of their data, you will need to implement an automation process to keep everyone’s reports up to date.
Considering that you also have to clean and transform your data before you can actually visualize it, we recommend getting yourself an all-in-one data analytics tool — a tool that will enable you to integrate, model, visualize, automate, and export your findings, all in one single platform. Imagine how much time you would save by not having to worry about managing different tools to achieve one single purpose: working on your ecommerce data and guiding the company toward data-driven decision-making through your insights.
If you’re interested in learning more about how an all-in-one data analytics tool could help you step up your ecommerce analytics game, how about you consider Y42?
Category
In this article
Share this article