
Today’s technology is removing the locks from a previously inaccessible source to most business users: data. More and more companies are striving to achieve a data-driven approach and base their business decisions on factual insights.
This is becoming possible thanks to the rise of new tools and technologies which have slowly “democratized” access to data. SaaS solutions such as Stitch, Fivetran, and Y42 are some of these tools. However, raw data is rarely structured or formatted in a way that allows you to analyze it and work with it directly.
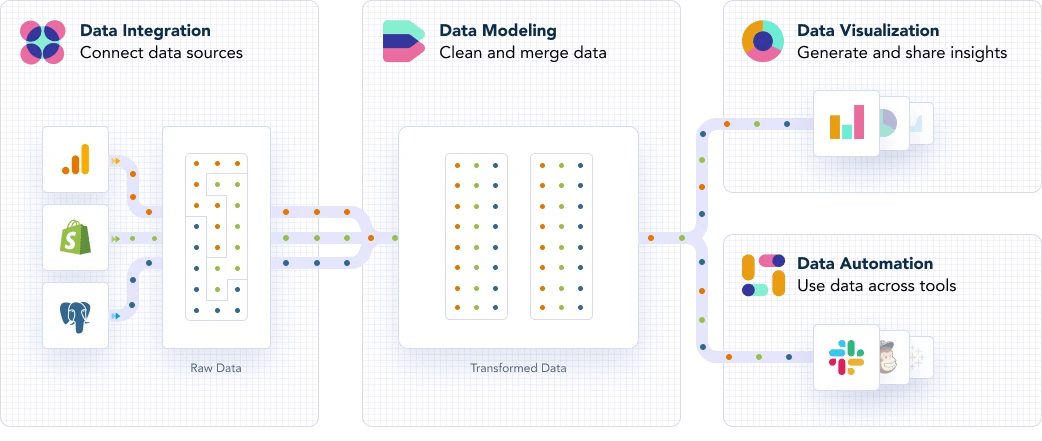
What can you do to understand raw data then? Simply put, you have to model it. Data modeling is the art and science of transforming raw data into human-usable metrics that reflect the performance of your business. It’s about arranging raw data into meaningful tables to enable analyses, reports and visualizations.
Why you should model your data
The ultimate goal of data modeling is to produce business insights, but for many companies, the importance of modeling itself remains unclear. The data transformation process builds the path from raw data to use cases where people aim to solve specific issues with the support of a report, a data flow automation, or an exploratory analysis.
However, having to access your raw data every time you need these types of insights can be tricky:
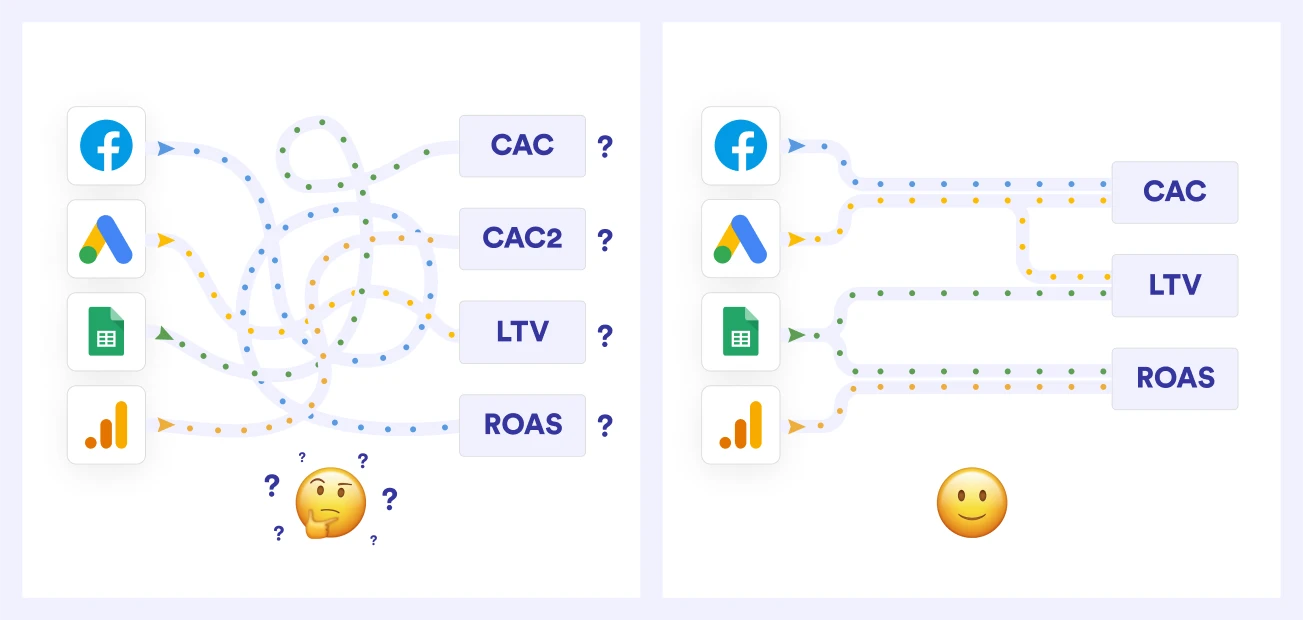
- If multiple people work with the same raw data and create an analysis on top of it, they will be constantly recreating internal business logic and metrics. This can lead to various analysts creating slightly different logic and conditions, and consequently, different metrics, outcomes and misleading business insights.
- You could be wasting money and working time by letting every analyst run data cleaning tasks repeatedly to prepare data for reports, ultimately working on duplicated tasks.
In order to avoid repeating preparatory tasks for each analysis, like renaming and recasting fields in the same dataset, you have to set your data modeling process, and you should only do this once, at the beginning.
Setting up this process also gives you a birds-eye view of your data lineage, allowing you to stay on top of your table structure and find errors or bugs immediately. Plus, cleaning and merging your data makes it easier for you to build a single source of truth.
How to model your data
The first thing to do before beginning the transformation process is to stop and think of an outline: what is the data flow going to look like from source to destination?
You need to understand your goal, namely, the dashboard or report you’re aiming to build. It is crucial to see the big picture before putting together the underlying tables that will feed into your reports and dashboards.
After deciding what your final use case is going to be, you can figure out what data you’re going to use to solve it and which sources will be relevant for this process. Do you want to have an automated ROI report? Will the data come from Google Ads or TikTok Ads?
Once you have gained an understanding of the journey as a whole, you can finally delve into the data modeling process. This procedure is structured in three different layers, which ensure maintainability, reusability, high performance and scalability. These layers are:
- Staging layer
- Mart layer
- Analytical layer
The idea behind this “division of labor” is to guarantee consistency by allowing users to explore their source data without conducting analyses or building reports directly on top of the raw source data.
Remember, the biggest data modeling mistake you can make is not having a model at all. If you want to learn more about the data modeling process and dig deeper into the different layers and steps that are to be followed when building your reports and dashboards, then you can refer to this comprehensive guide where we outline our data modeling best practices.
Category
In this article
Share this article